2026 Kubernetes Observability Guide: Pillars, Tools & Tips

Did you know that over 90% of organizations in the cloud-native community use Kubernetes in some form, whether in production, pilot, or evaluation? But running clusters is only half the challenge. Understanding what’s actually happening inside them is the other half.
Kubernetes observability is the practice of using metrics, logs, and traces to understand the internal state of your clusters. Not just whether something is broken, but why.
And as environments get more distributed, traditional monitoring simply can’t keep up. Teams need deeper visibility across the control plane, nodes, workloads, and networking to troubleshoot faster and catch issues before they snowball.
This guide breaks down the pillars, tooling, and workflows that make Kubernetes observability work in practice.
What Is Kubernetes Observability?
At its core, Kubernetes observability means understanding what’s happening inside your clusters based on the data they generate. This data comes in three forms: metrics, logs, and traces, each offering a different lens into cluster health, application performance, and resource behavior.
In a traditional infrastructure setup, you’re working with a relatively static environment. But with Kubernetes as your orchestration layer, pods spin up and get terminated in seconds, workloads shift across nodes, and networking rules change dynamically. This level of constant movement makes it impossible to rely on predefined dashboards and static alerts alone.
Observability fixes all of that. Instead of only telling you what broke, it helps you understand why it broke, and gives your team the context to fix it faster.
For organizations scaling their Kubernetes adoption, this is what separates teams that react to incidents from teams that get ahead of them.
Kubernetes Observability vs Monitoring
Kubernetes monitoring tracks predefined metrics and alerts when something crosses a threshold. It answers the question: “Is something wrong?” For example, CPU usage spikes, pod restart counts, or node memory pressure.
Kubernetes observability, on the other hand, goes deeper. It gives you the ability to ask open-ended questions about your system, even ones you didn’t anticipate, like “Why is something wrong, and where exactly is it happening?”
In practice, monitoring is a subset of observability. You need both, but observability is what gives your team the full picture. Once you have that data, utilizing structured Kubernetes troubleshooting workflows allows your team to resolve the underlying root causes faster.
| Feature | Monitoring | Observability |
|---|---|---|
| Goal | Detect known problems | Understand unknown or complex problems |
| Approach | Predefined dashboards and alert thresholds | Exploratory, query-driven investigation |
| Data types | Primarily metrics | Metrics, logs, and traces combined |
| Answers | “What’s broken?” | “Why is it broken and where?” |
| Scope | Individual components | Full system behavior across layers |
| Best for | Routine health checks and uptime tracking | Debugging, root cause analysis, capacity planning |
A solid monitoring stack like Prometheus and Grafana gives you the metrics foundation. Observability builds on that by correlating those metrics with logs and traces to provide full context.
Why Kubernetes Observability Is Uniquely Difficult
Kubernetes’ dynamic, distributed nature introduces layers of complexity that traditional infrastructure simply doesn’t have. In fact, 48% of organizations say that lack of knowledge among teams is the biggest challenge to gaining observability into cloud-native environments, up from 30% the year before.
Here are the biggest reasons platform teams struggle with Kubernetes observability on a day-to-day basis:
1. Ephemeral Workloads and Constant Change
One of the trickiest things about Kubernetes is that workloads are designed to be short-lived. Pods get created, do their job, and get destroyed, sometimes in seconds. A container that was running five minutes ago might not even exist anymore, and the data it generated can vanish with it. On top of that, autoscaling, rolling updates, and rescheduling keep the environment in constant motion, so nothing stays the same for long.
This makes it incredibly difficult to correlate signals over time because the thing you’re trying to debug may already have been replaced.
2. Massive Signal Volume With Limited Context
A single Kubernetes cluster can generate enormous amounts of telemetry data across metrics, logs, and traces. And making sense of it all is easier said than done.
Without proper labeling, correlation, and filtering, teams end up buried in data rather than finding the signal that actually matters.
3. Multi-Layer Architecture
Kubernetes operates across multiple layers: the control plane, nodes, pods, containers, networking, and storage, all at once. And the tricky part is that a problem at one layer can easily show up as a symptom somewhere completely different.
For example, an application timeout might have nothing to do with the app itself. It could be caused by a DNS misconfiguration at the cluster networking level.
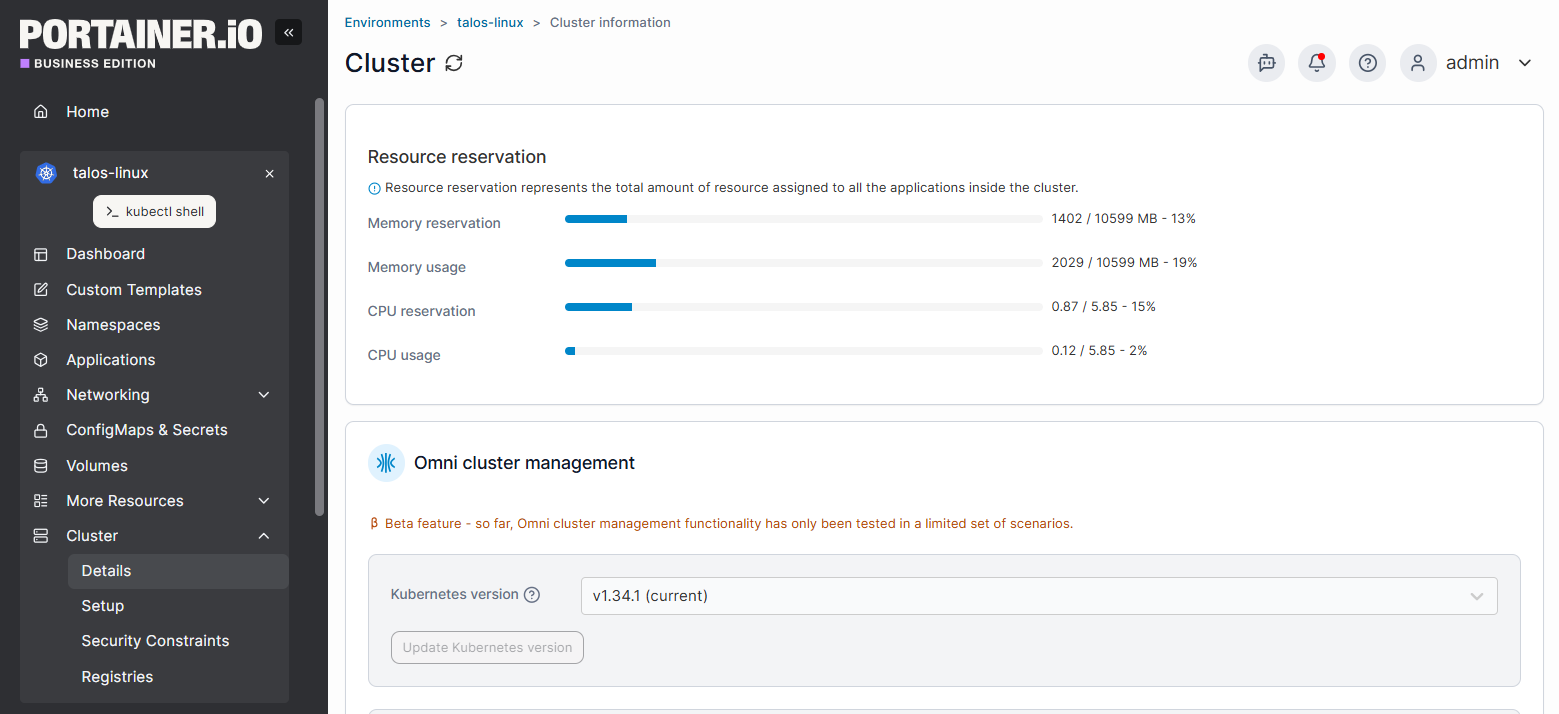
Without visibility into each layer, your team ends up chasing symptoms instead of root causes. Understanding the complete Kubernetes architecture is essential to knowing where to actually look.
4. Distributed and Hybrid Environments
Most Kubernetes deployments today span across on-premises, cloud, and multi-cloud setups. And each environment comes with its own networking rules, access policies, and telemetry formats. This alone makes getting a unified view of your clusters a real operational challenge.
It gets even harder when teams are managing multiple clusters across different providers, because the tooling, formats, and access patterns rarely line up cleanly. What works for observability in one environment doesn’t always translate to another.
Managing Kubernetes doesn’t have to be this complex. Portainer gives teams a single, lightweight interface to manage clusters, monitor health, and maintain visibility across all environments. See how it works →
Main Pillars of Kubernetes Observability
Kubernetes observability is built on three core pillars: metrics, logs, and traces. Each one captures a different type of signal from your clusters, and together, they give your team the full picture of what’s happening, what went wrong, and why.
1. Metrics
Metrics are numerical measurements collected over time. In Kubernetes, that includes data like CPU and memory usage per pod or node, network throughput, request latency, error rates, and disk I/O. They’re your first line of defense for spotting problems because they tell you that something is off.
Tools like Prometheus are widely used for scraping and storing Kubernetes metrics, while Grafana is the go-to for visualizing them through dashboards and alerts. Kubernetes also natively supports the Horizontal Pod Autoscaler (HPA), which uses metrics to automatically scale workloads up or down based on real-time demand.
Where metrics fall short is in explaining the why. A CPU spike tells you something is happening, but not what’s causing it. That’s where the other two pillars come in.
2. Logs
Logs are timestamped text records of events generated by your applications, containers, and cluster components. In Kubernetes, that includes everything from application error messages and container stdout/stderr output to control plane activity.
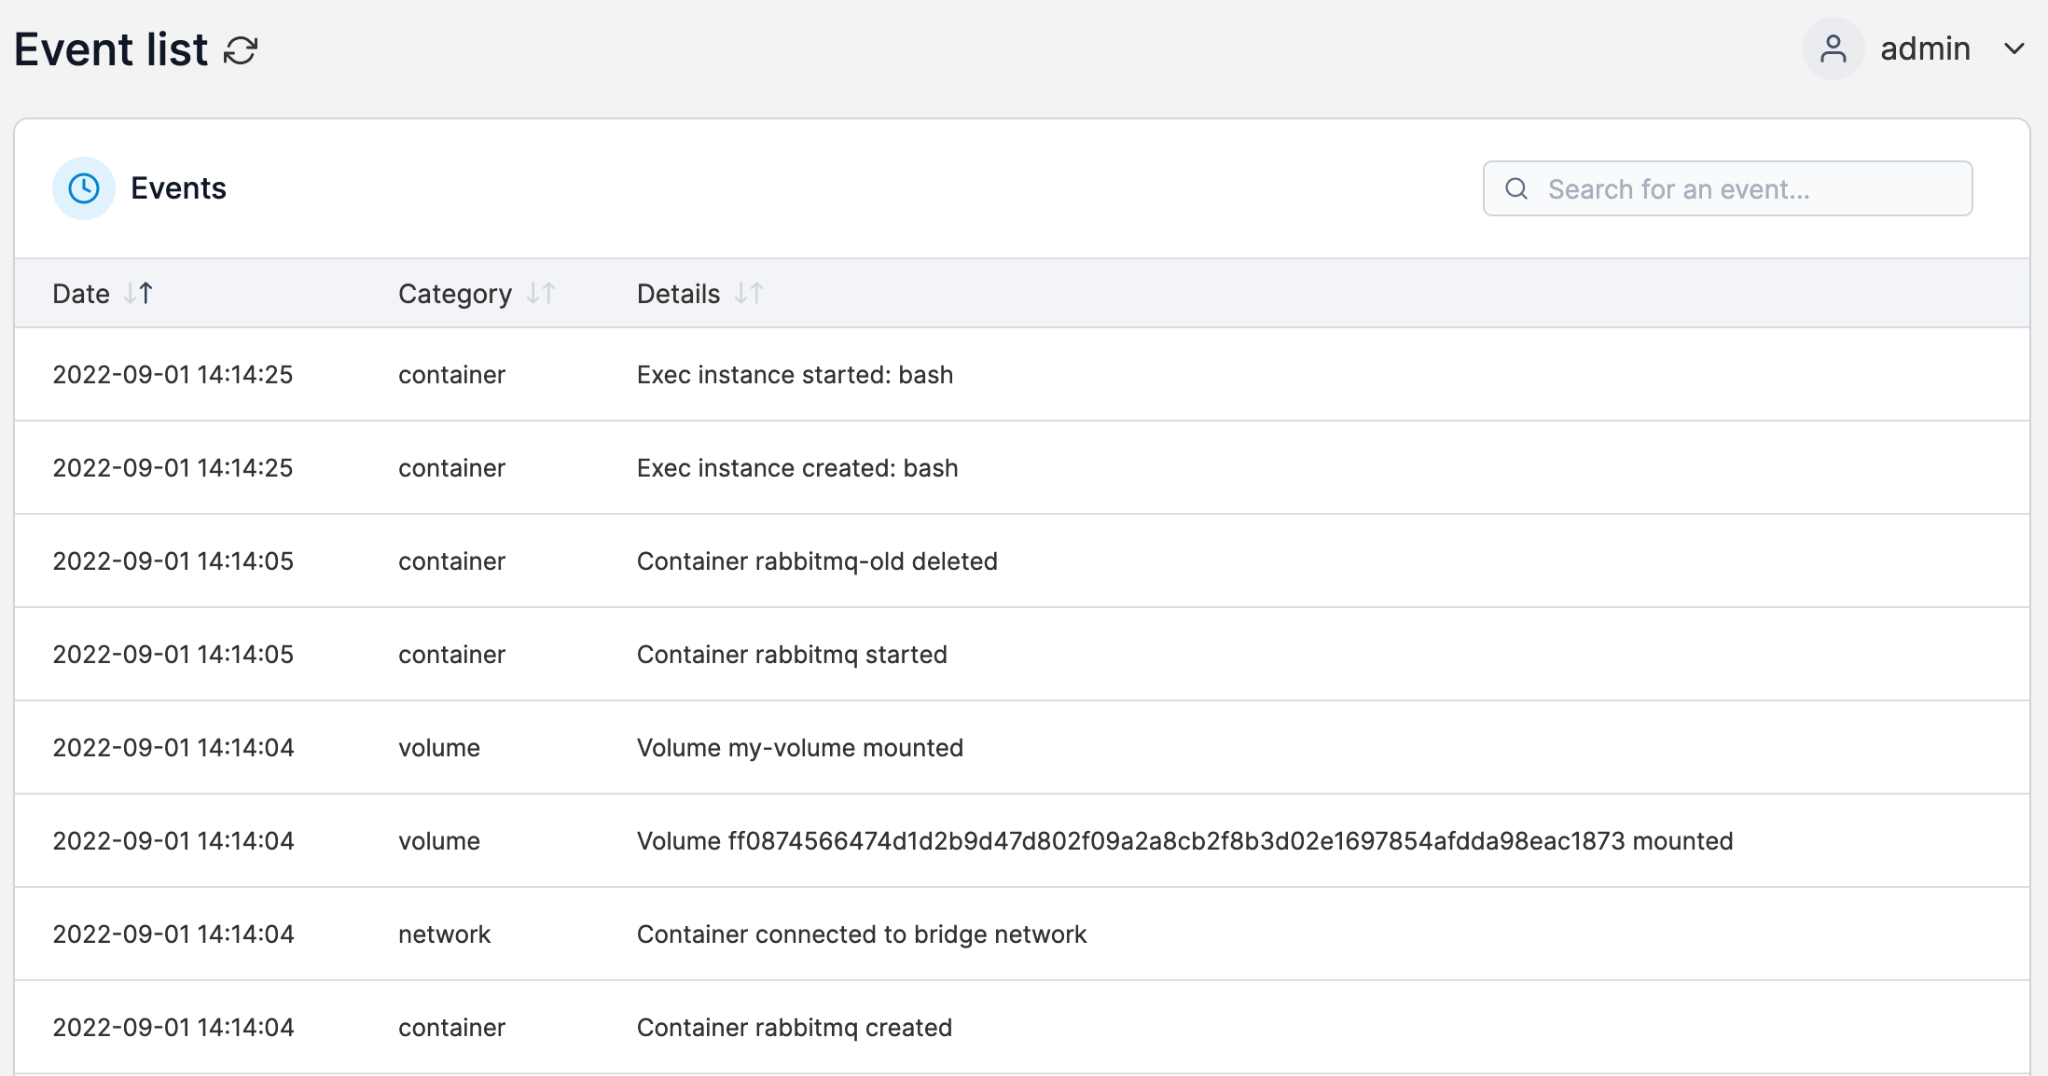
Logs are where you go when you need detail. If a pod crashes, the logs tell you exactly what happened leading up to the failure.
The challenge in Kubernetes is volume and fragmentation, because, with hundreds or thousands of containers generating logs at the same time, you need a centralized logging solution to collect, store, and query them efficiently. Tools like Fluent Bit, Fluentd, and Grafana Loki are commonly used for this.
3. Traces
Traces track the journey of a single request as it moves through your system. In a microservices architecture running on Kubernetes, a single user request might pass through five, ten, or even more services before returning a response. Traces connect those individual service calls into one end-to-end view.
This makes them essential for diagnosing latency issues and understanding service dependencies. OpenTelemetry has become the standard for instrumenting applications and collecting trace data, with backends like Jaeger and Zipkin used for storage and visualization.
What to Observe Across the Kubernetes Stack
Knowing the three pillars is one thing, but knowing where to point them is another.
Kubernetes runs across multiple layers, and each one generates signals that matter. Here’s a breakdown of what to observe and why it’s important at each level.
1. Control Plane
The control plane is the brain of your cluster. It includes the API server, etcd, the scheduler, and the controller manager. If any of these components degrade, the entire cluster suffers, whether that’s due to failed deployments, scheduling delays, or state inconsistencies.
Key things to watch out for here are:
- API server request latency and error rates
- etcd disk sync duration and leader elections
- Scheduler queue depth
- Controller reconciliation loops
What makes control plane observability tricky is that issues here rarely look like control plane issues at first. They tend to surface as strange behavior elsewhere in the cluster, which is exactly why having visibility at this layer matters. The earlier you catch a problem here, the less time you spend chasing symptoms downstream.
2. Nodes
Nodes are the machines (virtual or physical) that actually run your workloads. Each node runs a kubelet, a container runtime, and kube-proxy. If a node becomes unhealthy, every pod on that node is affected.
At this layer, you want to keep a close eye on CPU and memory utilization, disk pressure, network I/O, and kubelet health. It’s also worth paying attention to node conditions like Ready, MemoryPressure, and DiskPressure, as these are often the earliest indicators of trouble.
Together, these signals tell you whether your nodes have the capacity to handle the workloads assigned to them, or whether you’re heading toward resource exhaustion.
3. Workloads
This is the layer most teams care about first: the deployments, pods, and containers running your actual applications.
Observability here means tracking pod restarts, container resource usage, readiness and liveness probe failures, and replica counts. It’s also worth monitoring Kubernetes events at this layer, things like FailedScheduling, Evicted, or BackOff, which surface issues that don’t always show up in container logs.
The tricky part is that workload problems often originate elsewhere. A pod stuck in Pending might be a scheduling issue, and a CrashLoopBackOff might trace back to a misconfigured config map. Workload observability works best when it’s connected to the other layers.
4. Networking
Kubernetes networking ties everything together: service discovery, ingress routing, DNS resolution, network policies, and service types like ClusterIP, NodePort, and LoadBalancer.
Watch for DNS lookup latency, service endpoint health, ingress error rates, and dropped connections. Network issues are among the hardest to debug in Kubernetes because they often masquerade as application problems.
See portainer in action
5. Persistent Storage
For teams running stateful workloads, storage observability is a must. This means monitoring persistent volume (PV) capacity, I/O throughput and latency, volume mount failures, and storage class availability.
A slow or full persistent volume can silently degrade performance, causing timeouts and errors that appear to be application bugs rather than storage issues.
6. Application Performance
Everything above covers infrastructure and platform health. But none of that tells you how your actual services are performing for end users. Application-level observability focuses on what’s often called the four Golden Signals: latency, traffic, errors, and saturation.
For microservices running on Kubernetes, this means tracking request duration per service, error rates by endpoint, throughput, and how close each service is to its resource limits. Distributed tracing is especially important here because when a user request passes through multiple services, you need to see exactly where slowdowns or failures are occurring.
Without application-level observability, you can have a perfectly healthy cluster that’s still delivering a poor experience to your users.
How to Build a Kubernetes Observability Workflow
Observability only works if your team has a repeatable workflow in place. Here’s a practical, step-by-step framework for building one.
Step 1: Define Your Observability Goals
Before instrumenting anything, get clear on what you’re trying to achieve.
Are you focused on reducing incident response time? Improving uptime for a specific service? Meeting compliance requirements? Or something else?
Your goals will determine which signals to prioritize, what thresholds to set, and where to invest your time.
Without this step, teams often end up collecting everything and understanding nothing. Start with the outcomes you care about, then work backward to the data you need.
Step 2: Instrument Your Clusters and Applications
Once your goals are defined, make sure your clusters and applications are generating the right data.
That means enabling metrics endpoints across control plane components, deploying a log collection agent to centralize container and node logs, and instrumenting your applications with OpenTelemetry for distributed tracing.
The goal here is to collect the signals that align with the objectives you set in Step 1. And wherever possible, automate this process. Kubernetes automation through tools like Helm charts and operators can help you deploy and maintain your observability stack consistently across clusters."
Step 3: Centralize and Correlate Your Data
Now, bring your metrics, logs, and traces into a centralized platform where your team can query, correlate, and visualize them together.
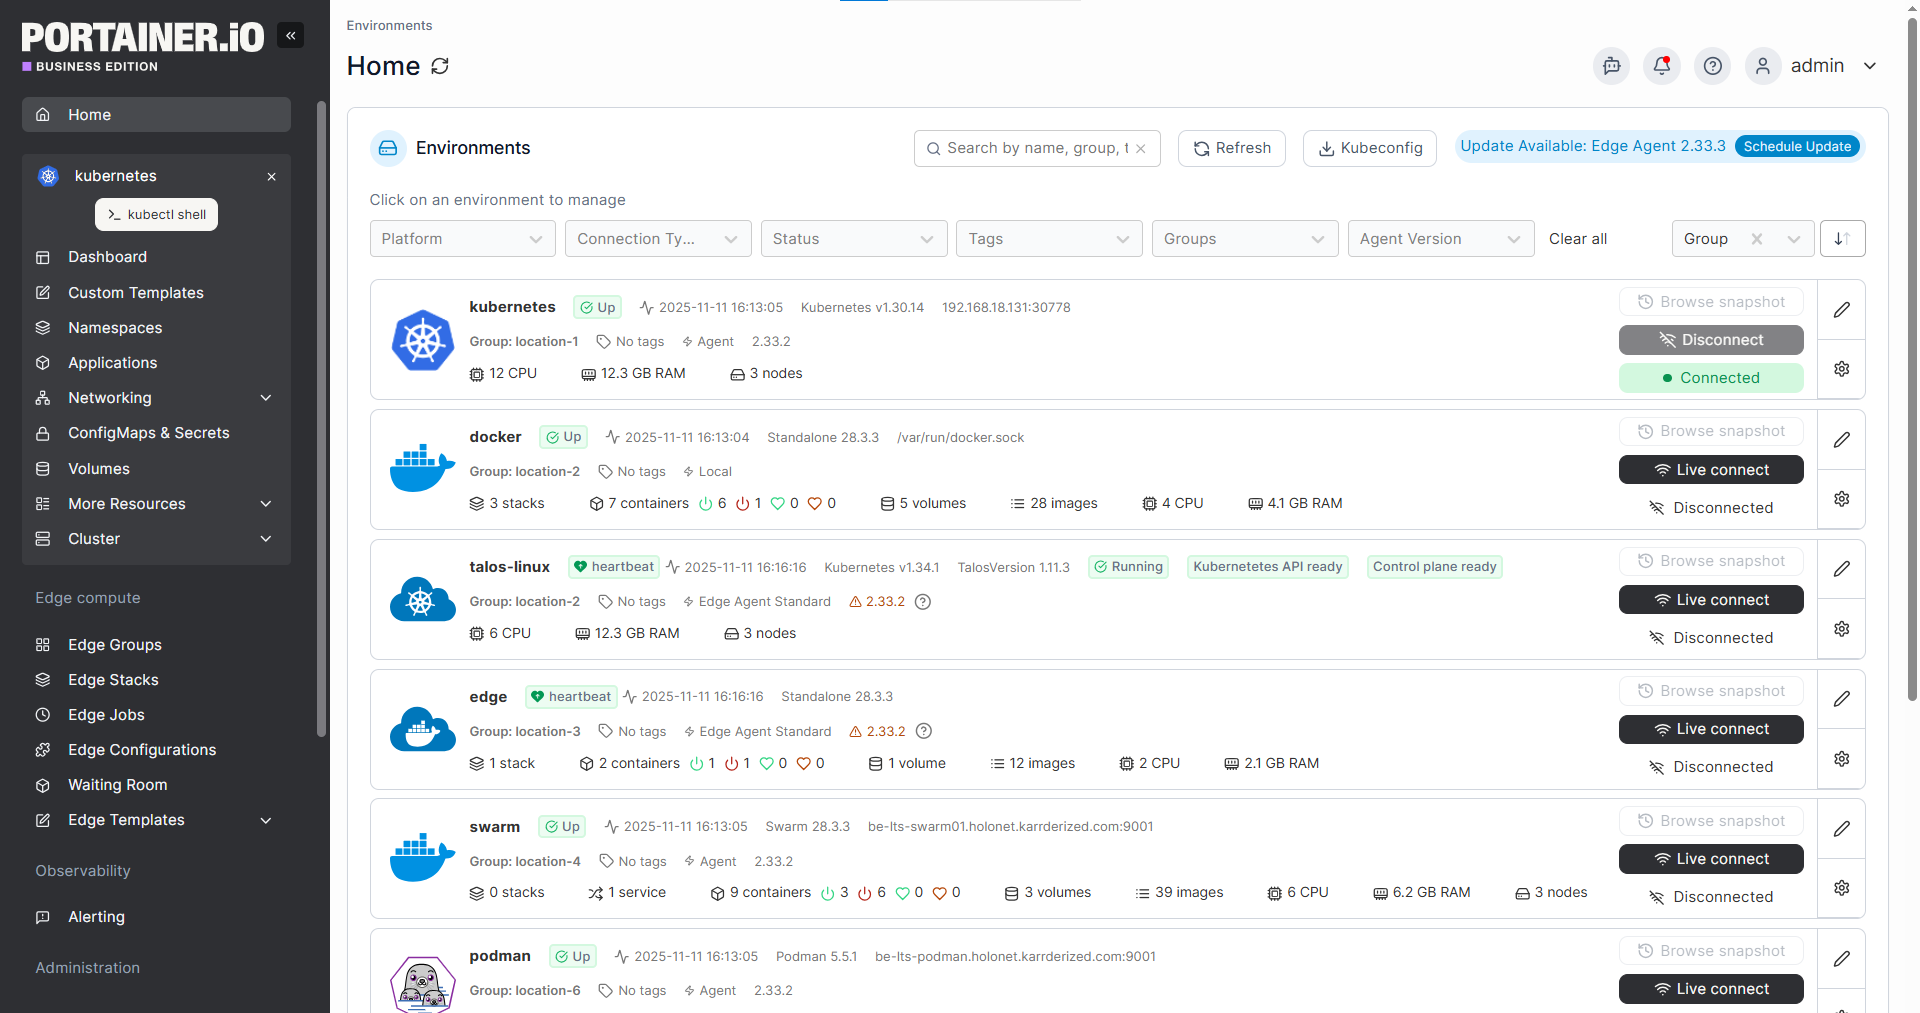
Focus on consistency at this stage. Use standardized Kubernetes labels such as app, namespace, and version across all your resources so that, when something breaks, you can correlate signals across layers without guessing.
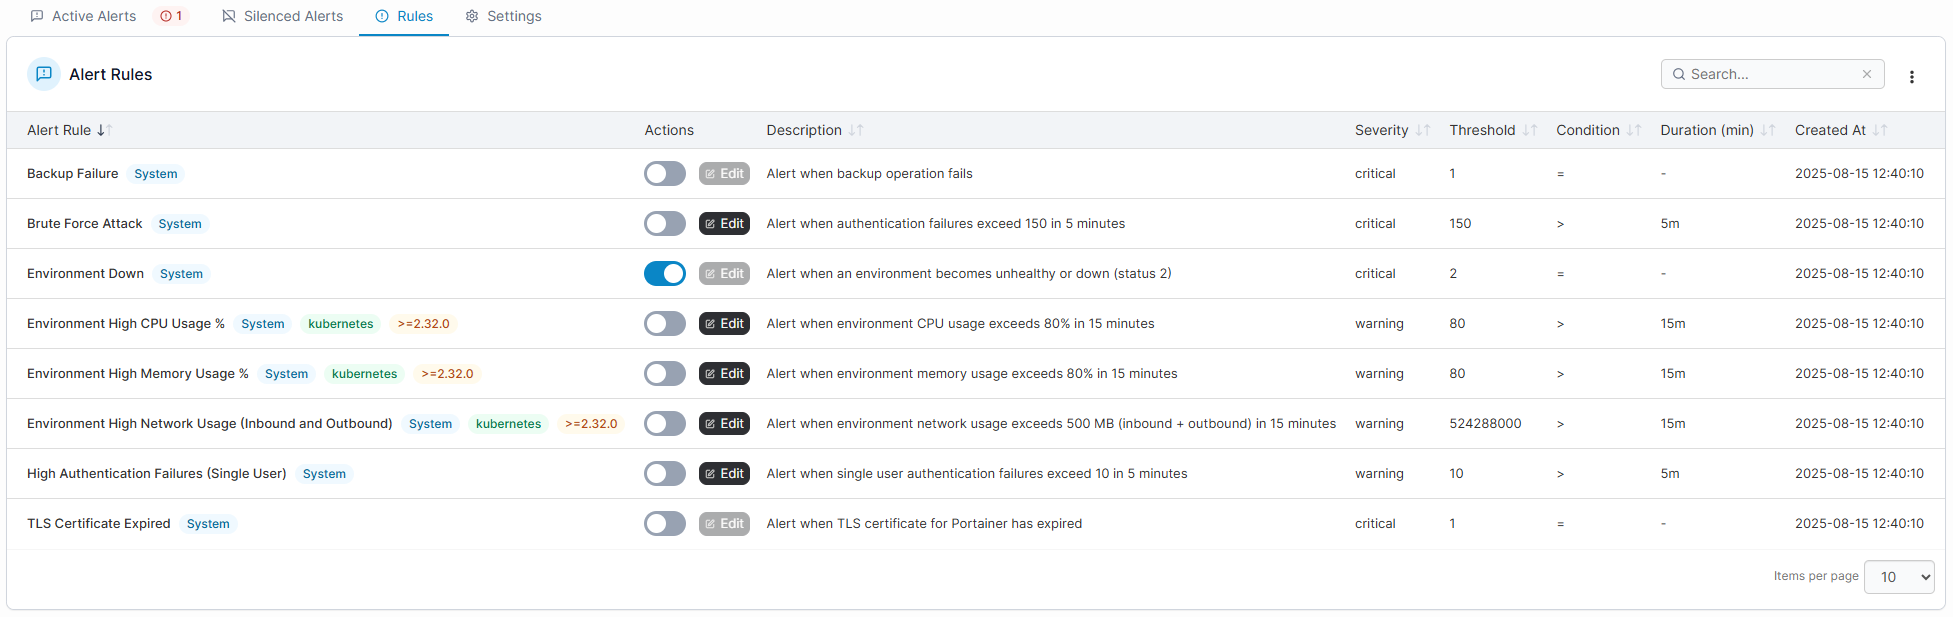
Step 4: Define Alerts That Actually Matter
Alerting is where observability turns into action. But it’s important to note that more alerts don’t mean better observability. In fact, too many alerts can eventually lead to fatigue, and teams start to ignore them altogether.
Focus on alerts tied to real impact, like service-level objectives (SLOs), error rate thresholds, resource exhaustion warnings, and control plane health.
Every alert should have a clear owner and a defined response path; if it fires and nobody knows what to do with it, it shouldn’t exist.
Step 5: Build Dashboards for Different Audiences
Here’s something a lot of teams get wrong: building one massive dashboard and expecting everyone to use it.
Platform engineers need deep cluster-level visibility, developers need application-level performance data, and team leads need a high-level overview of health and availability.
Build Kubernetes dashboards that match these different perspectives, so each team member can find what they need without wading through irrelevant data.
See portainer in action
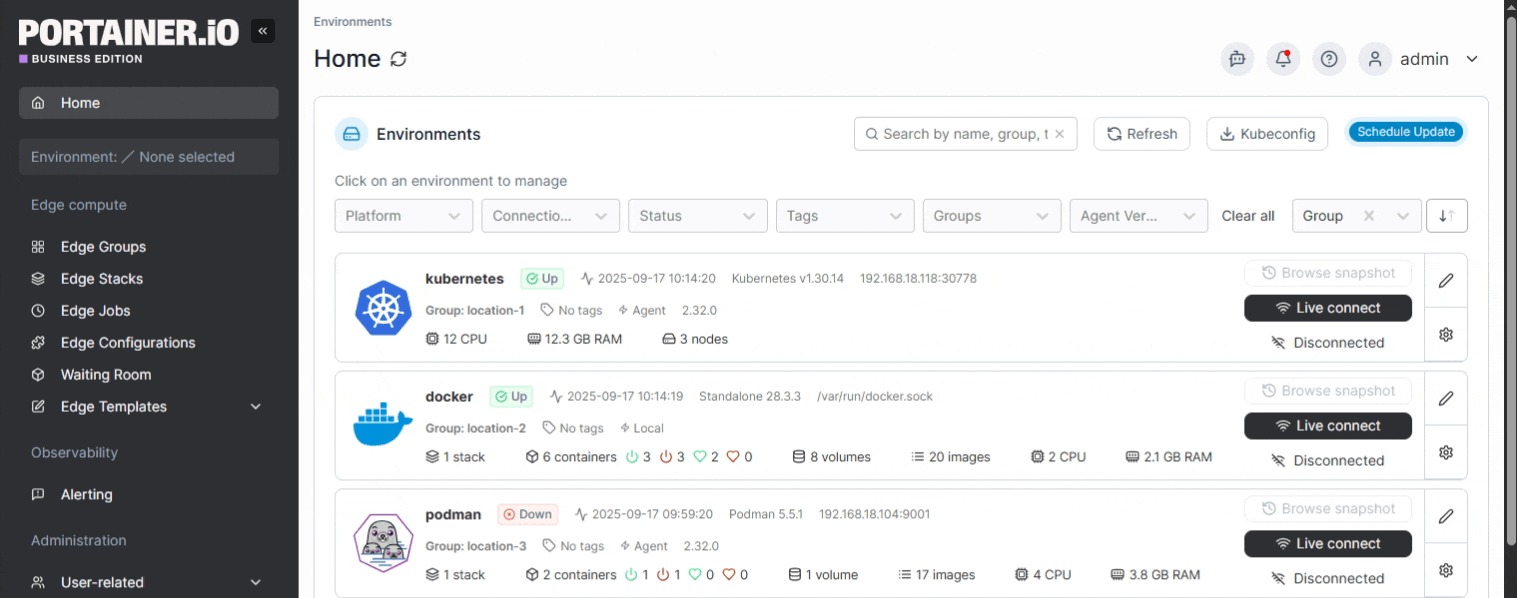
Step 6: Use a Management Platform for Unified Visibility
As your clusters grow, managing observability across multiple environments becomes a challenge in itself. This is where a container management platform like Portainer makes a real difference.
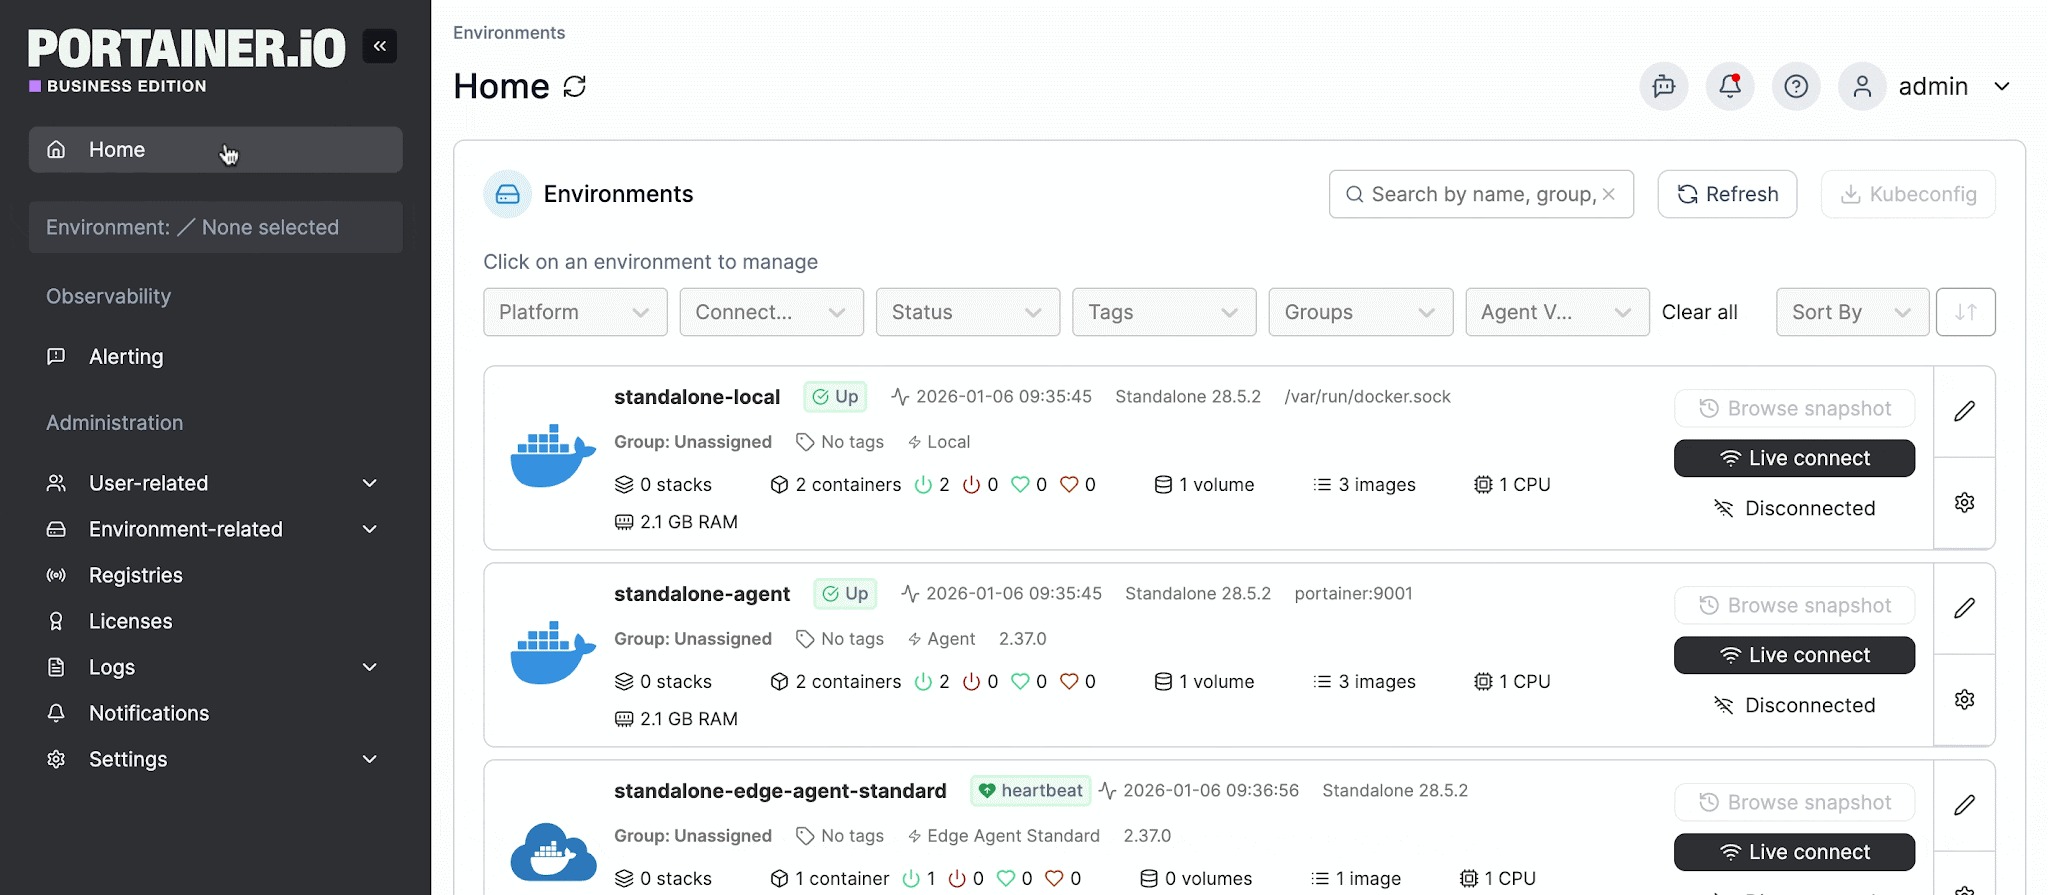
Portainer is a lightweight, self-hosted container management platform that gives teams a single interface to manage Kubernetes and Docker environments, view metrics, access logs for both nodes and applications, and monitor cluster health across all environments.
With metric server enabled, you can get real-time CPU and memory data directly in the UI. And through the Portainer API, you can feed that data into tools like Prometheus and Grafana for deeper analysis.
For teams that need observability without the overhead of stitching together a dozen different tools, Portainer gives you one place to see everything without the configuration burden.
Kubernetes Observability Best Practices
Keeping Kubernetes observability effective as your environments scale takes some intentional effort. Here are some best practices to help you stay on track:
- Start small and expand gradually. It’s tempting to instrument everything from day one, but that often leads to a flood of data that nobody has time to make sense of. Start with the most critical services and clusters, solidify your workflow, and then expand coverage over time.
- Treat observability as code. Your dashboards, alert rules, and instrumentation configs should be stored in version control, just like your application code. This makes them reviewable, reproducible, and recoverable. Teams already using GitOps workflows will find this a natural extension of their existing workflows.
- Enforce consistent labeling standards. If your teams aren’t using consistent Kubernetes labels across namespaces, deployments, and services, correlating data across the stack becomes painful. Define a labeling convention early, document it, and enforce it as part of your deployment process.
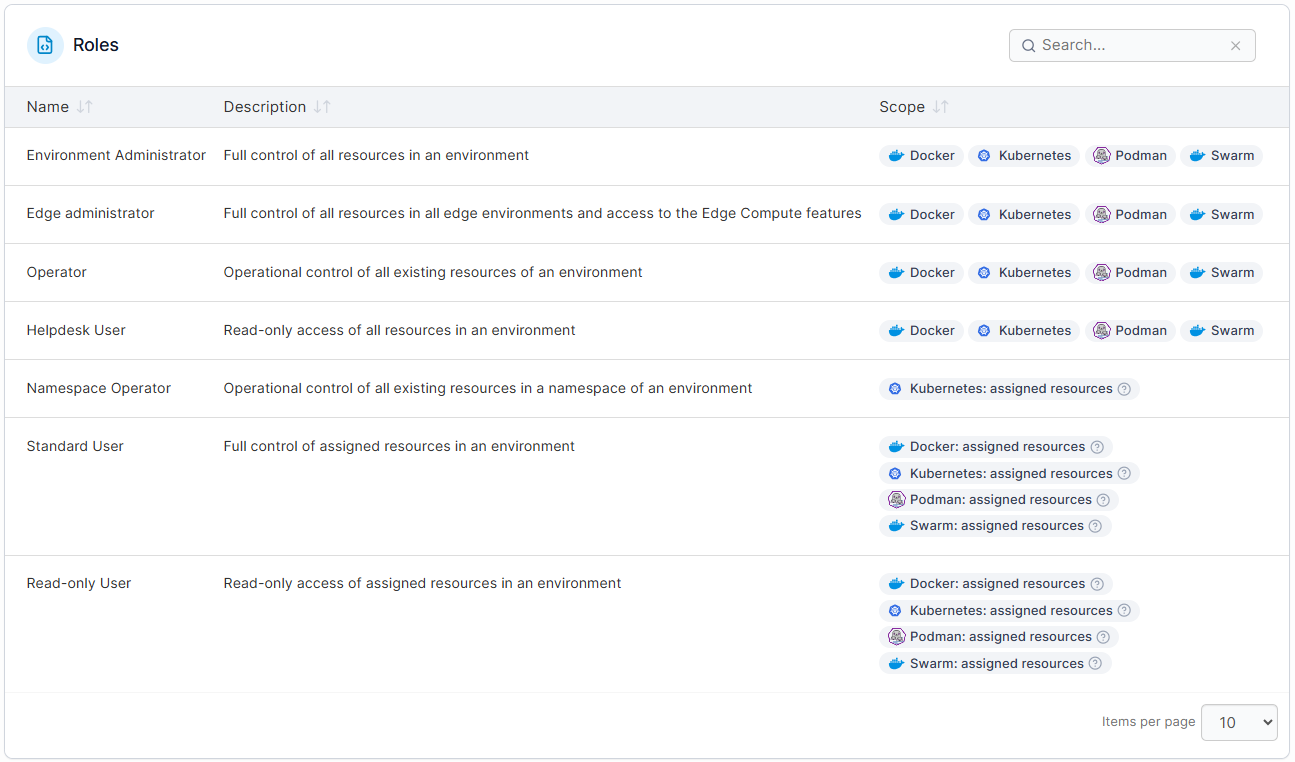
- Set up role-based access for observability data. Not everyone needs access to everything. Sensitive logs, cluster-level metrics, and audit trails should be scoped to the right teams. Role-based access control keeps observability data secure without slowing down the people who need it, especially in regulated industries where governance requirements are strict.
- Review and prune regularly. Observability setups decay over time. Dashboards go stale, alerts lose relevance, and unused metrics pile up. Schedule regular reviews to prune what’s no longer useful and update what’s changed. This keeps your setup lean and your team’s trust in the data high.
- Integrate security into your observability strategy. Observability and security go hand in hand. Integrate Kubernetes security telemetry with your existing observability stack. Use container security best practices as the foundation, and align your observability maturity with your overall operational maturity framework. The best Kubernetes management tools for enterprise environments increasingly include these capabilities out of the box.
Simplify Kubernetes Observability with Portainer
Kubernetes observability doesn’t have to mean stitching together a dozen different tools and spending weeks configuring everything. The fundamentals are straightforward: understand your three pillars, know where to look across the stack, build a repeatable workflow, and keep it lean as you scale.
Portainer helps teams do exactly that. It’s a lightweight, self-hosted platform that gives you centralized visibility into metrics, logs, and cluster health across all your environments, whether you’re running on-prem, in the cloud, or at the edge.
Book a demo today and see how Portainer fits into your observability workflow.