

Share this post
Out of the box, Portainer supports monitoring Kubernetes clusters via the metrics server/API, which gives you basic CPU and Memory stats for Pods and Nodes. But what if you want more bells and whistles?
Most people are familiar with Prometheus and Grafana, but how do you go about deploying them into Portainer managed Kubernetes Clusters? Let me show you.
First up, login to a Portainer instance that is managing one or more Kubernetes cluster.
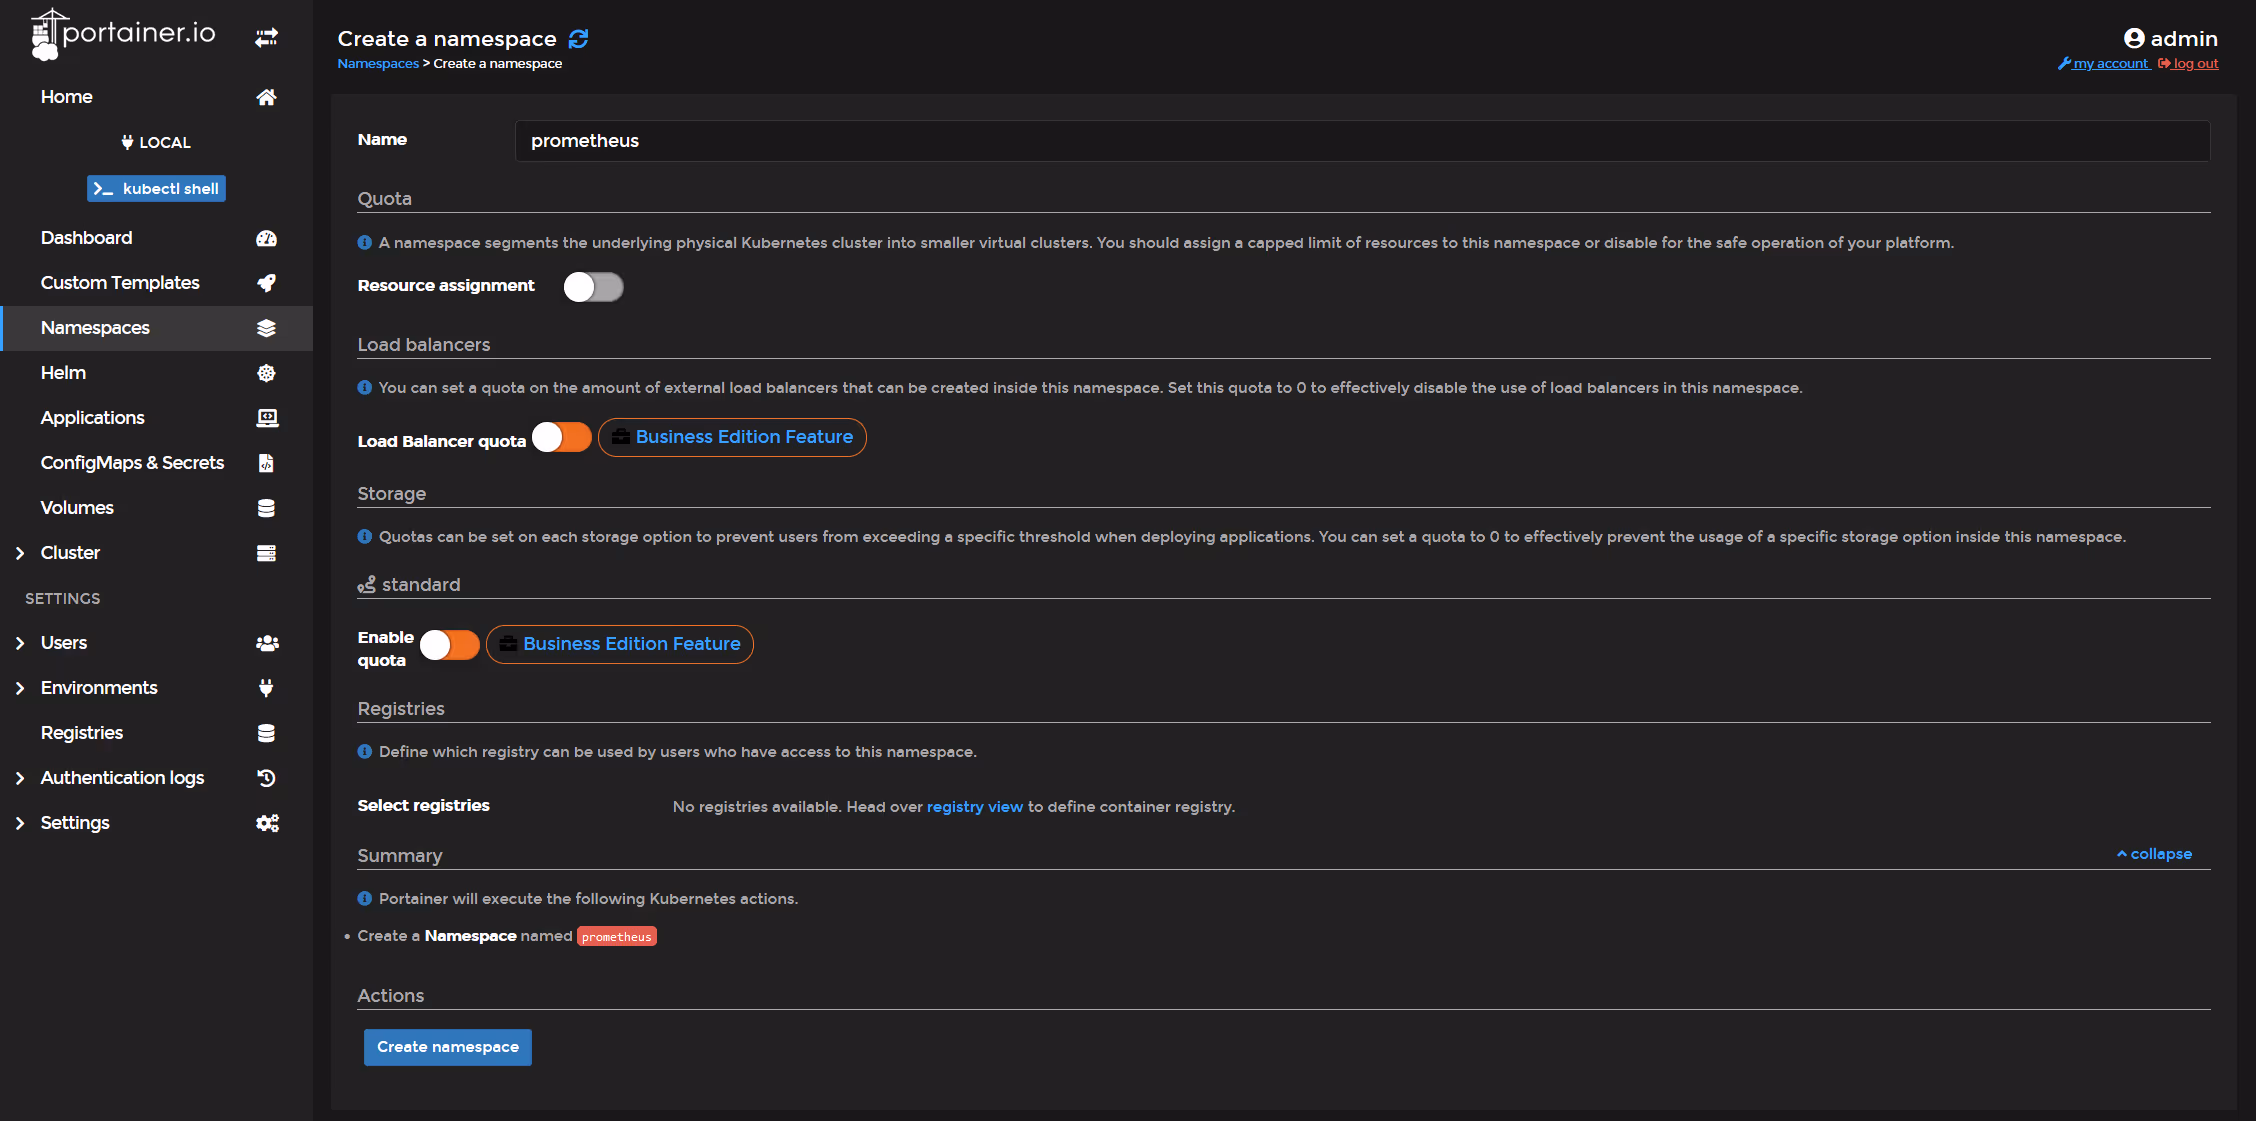
Select the Cluster you wish to install Prometheus on,,then click on "Namespaces" and create a simple namespace.
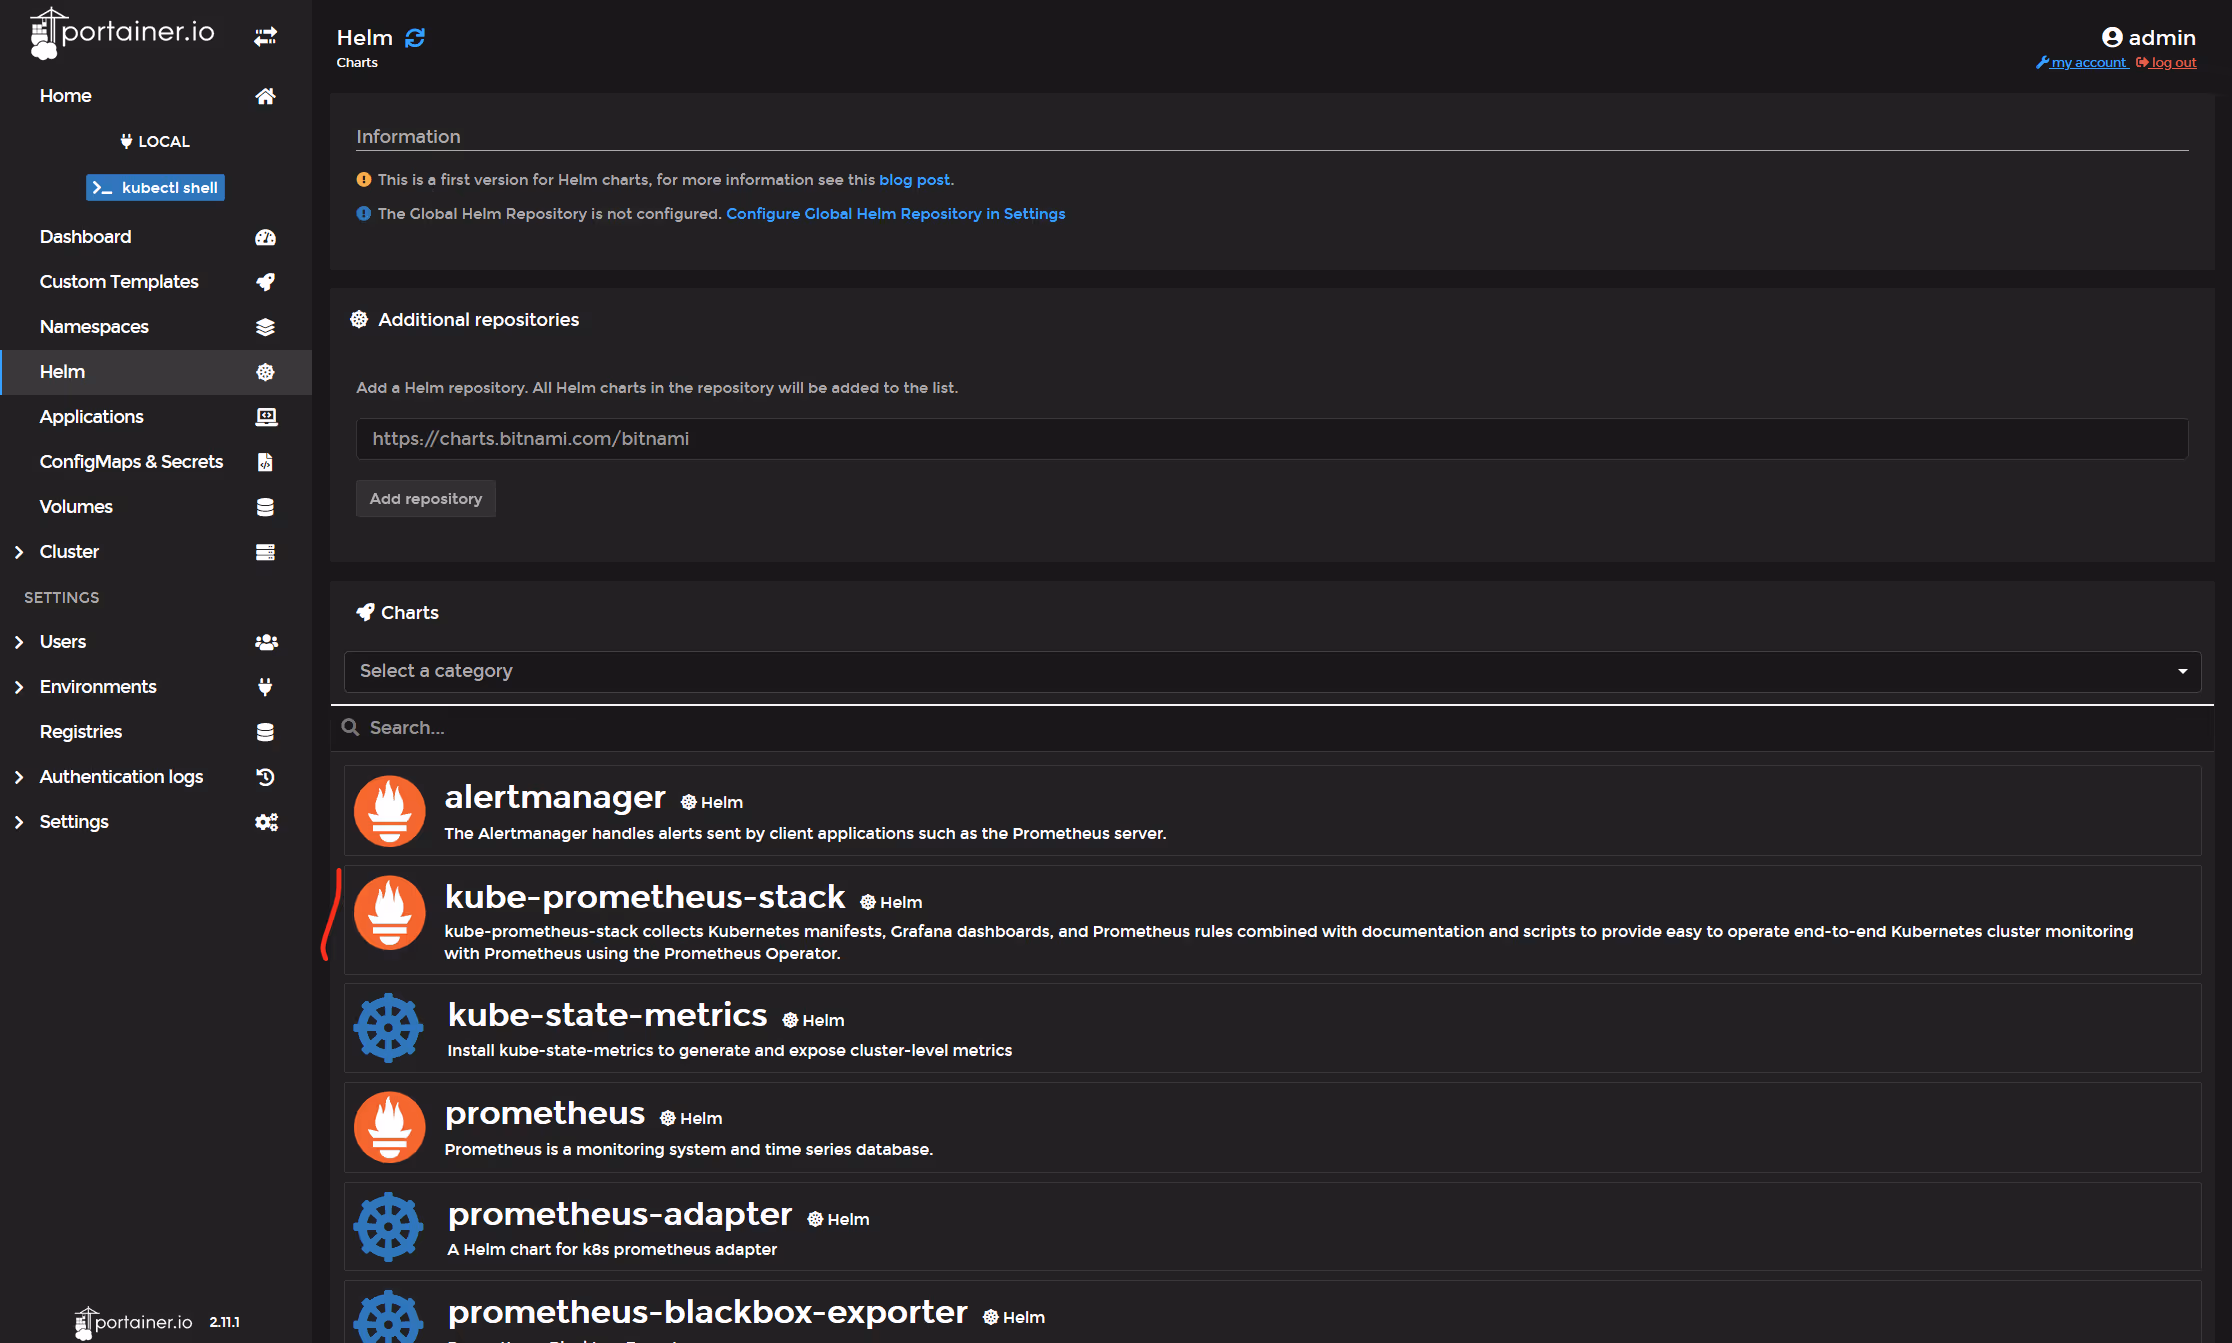
Now click on 'HELM'.
in the "Additional Respostories" field, type in https://prometheus-community.github.io/helm-charts, then click "Add Repository"

Choose "Kube-Prometheus-stack".
Note, for this to deploy, my nodes needed >4GB RAM, else OOM errors will be generated (the cluster was empty except this stack)
Select the namespace, give the deployment a name, then click "Install".

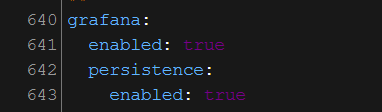
Note that this "default" deployment does not persist the Prometheus data, so if you want to do that, you need to edit the custom values.
Alert Manager:

Grafana:
Prometheus:

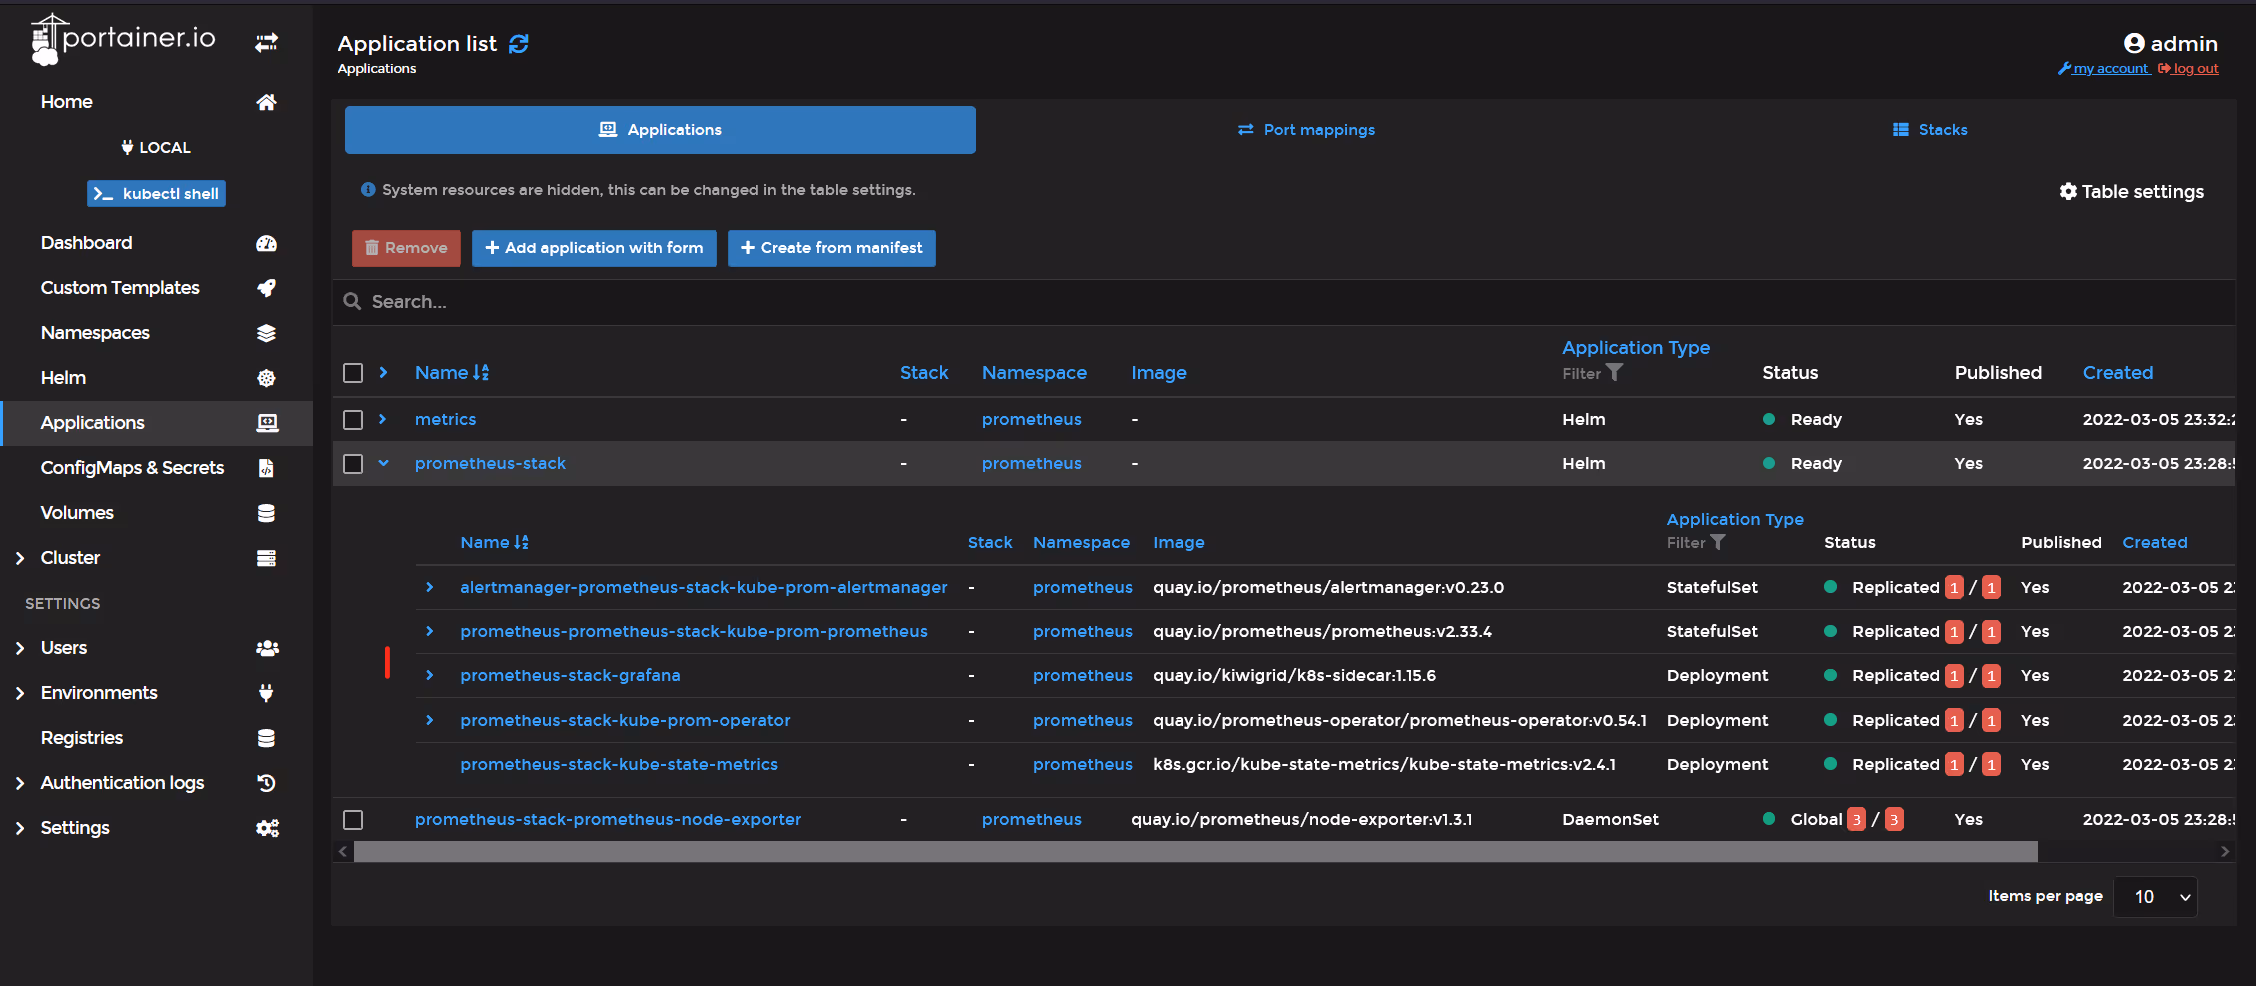
Once the deployment has finished, navigate to "Applications" and check that all is good.

If your cluster does NOT have the metrics server installed ,and you would like to use Prometheus as your metrics server, go back into HELM, and deploy the chart "prometheus-adapter", which will configure Prometheus as a pseudo "metrics-server".
Edit the custom values,
1) In Line 31, Add the URL of the Prometheus instance deployed above.. in this case it is: http://prometheus-stack-kube-prom-prometheus.prometheus

2) Starting line 102 and going through to line 126, uncomment all of the "resources:" section (note, make sure to remove the {} brackets after resources:). Click "Install"

Once that is installed and running, go into "Cluster" and then "Setup" and enable features that use the metrics API. It should succeed if the HELM chart above deployed OK.

To check, click on "Cluster" and then view the stats for a node..

OK, so now Prometheus is installed, the adapter is installed to provide metrics services via the metrics API, but how do you actually access Grafana and Prometheus UI?
Go back to applications, expand the "prometheus-stack" and then click on "prometheus-stack-grafana"
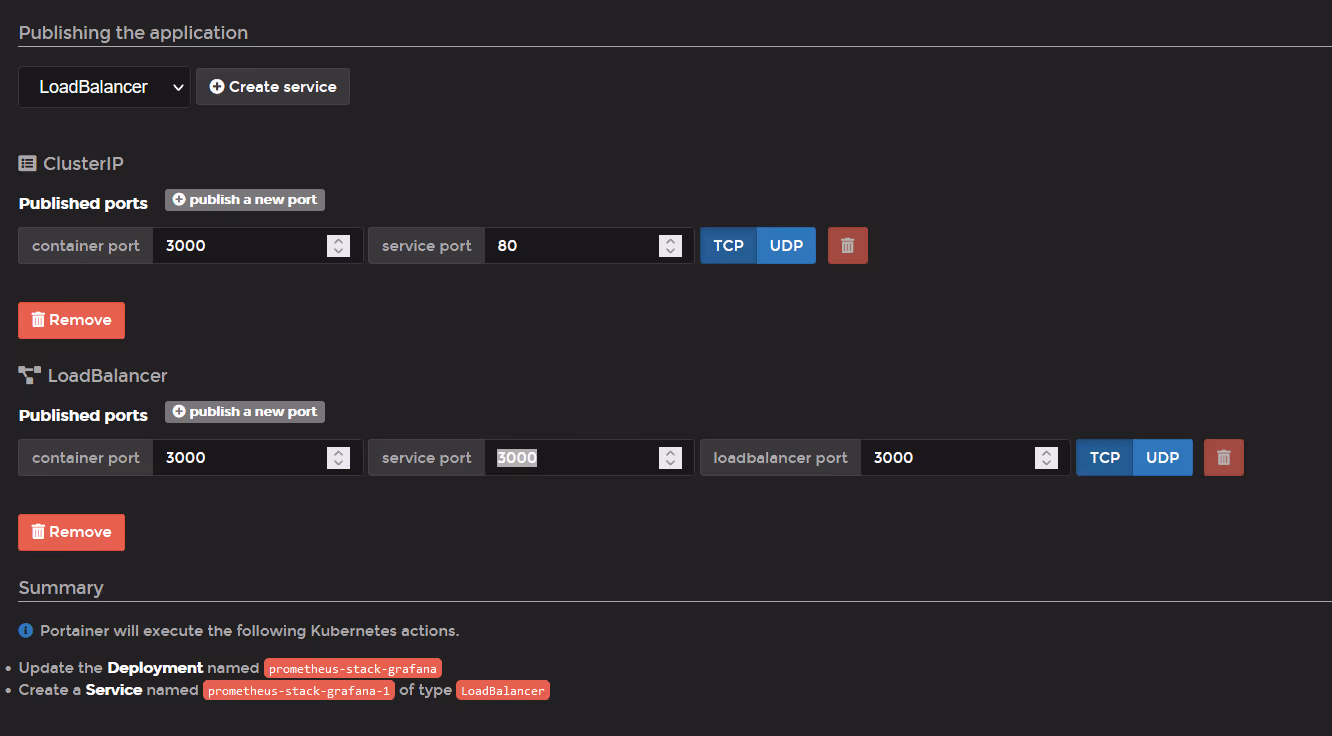
Note it is only presenting itself inside the cluster, as a clusterIP

If you want to access it externally, you can just click "edit application" and add a service that suits your needs, in my case I have selected "LoadBalancer" and exposed Port 3000.
After updating the service presentation, you should now get the default admin password for Grafana. Scroll down to "config" and click on the config for admin-password

Here are the default credentials:

OK, so let's open Grafana.

And open a default dashboard, Node (Pods)

Success.
If you choose to expose the Prometheus UI, you'll not it has no authentication in front of it, so I would be hesitant mapping it to a load balancer.
So this is how you can deploy Prometheus and Grafana with Portainer, and use it as a substitute for metrics server.
For optional Part 2 of this blog, adding additional Prometheus instances to this Grafana deployment, click here ->. https://www.portainer.io/blog/deploy-prometheus-monitoring-stack-with-portainer-part-2

.png)
.png)
.png)