
This blog might seem like a "back to the future" moment, given the near all-encompassing commentary around Kubernetes, and Swarm being "dead". The reality though is that Swarm isn't dead, and its still out there solidly (and reliably) solving container orchestrator challenges for a wide range of companies who dont care for Kubernetes and its complexity/learning curve. Here at Portainer, we actually continue to see pretty consistent (and slightly growing) swarm use amongst our user community.
So for those Swarm lovers out there, how can you get similar monitoring capabilities that seem commonplace for Kubernetes? Easy..
In this article, we will explore how to use a recently added Portainer App Template to deploy Prometheus and Grafana into a Docker Swarm cluster, and then use this for advanced resource monitoring.
How to deploy the Prometheus and Grafana stack in Portainer
First up, validate that your Portainer instance is using the Portainer provided list of App Templates, because if you have adjusted this to use a community repo, you will not see our new template. You can check this in settings, as per the below: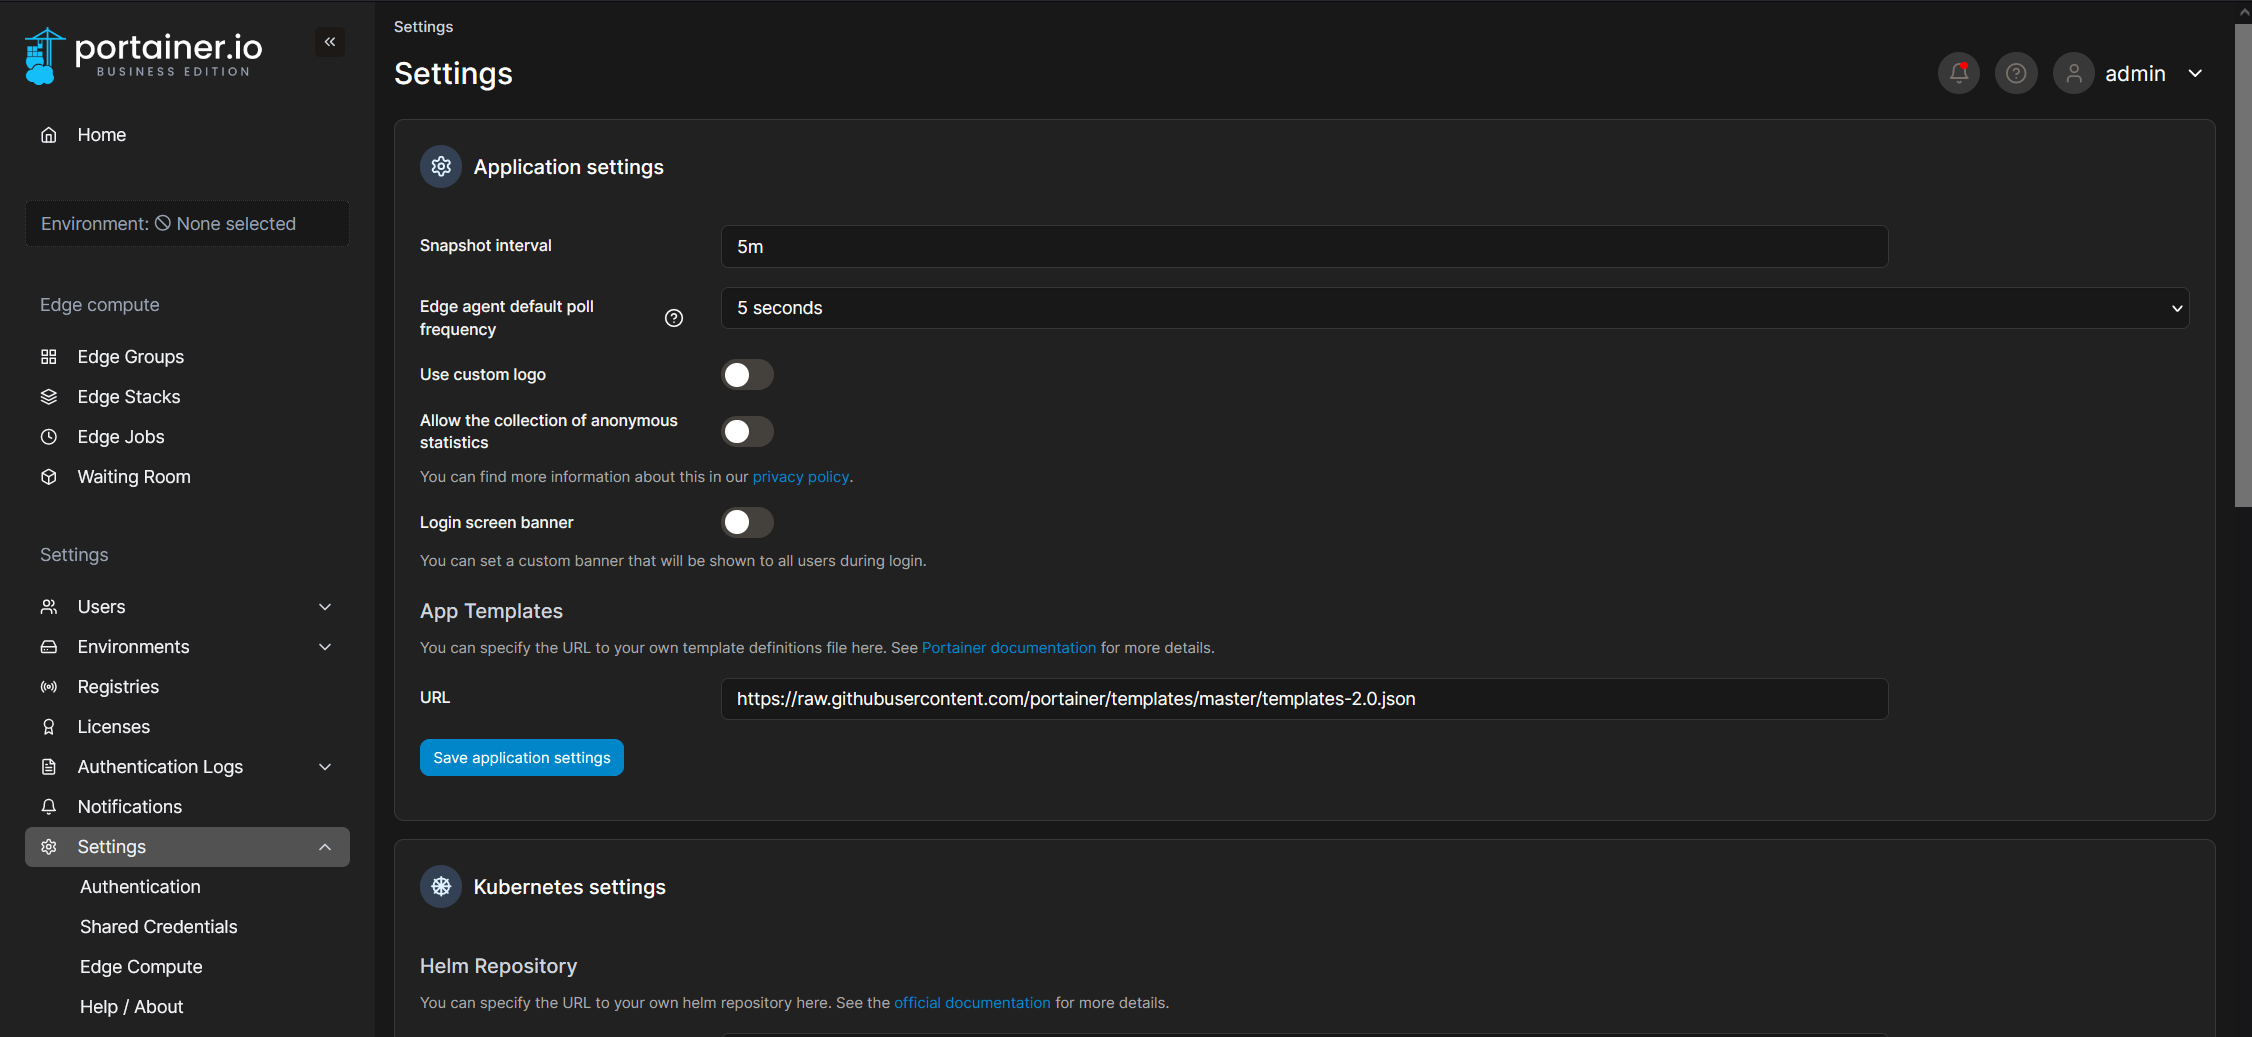
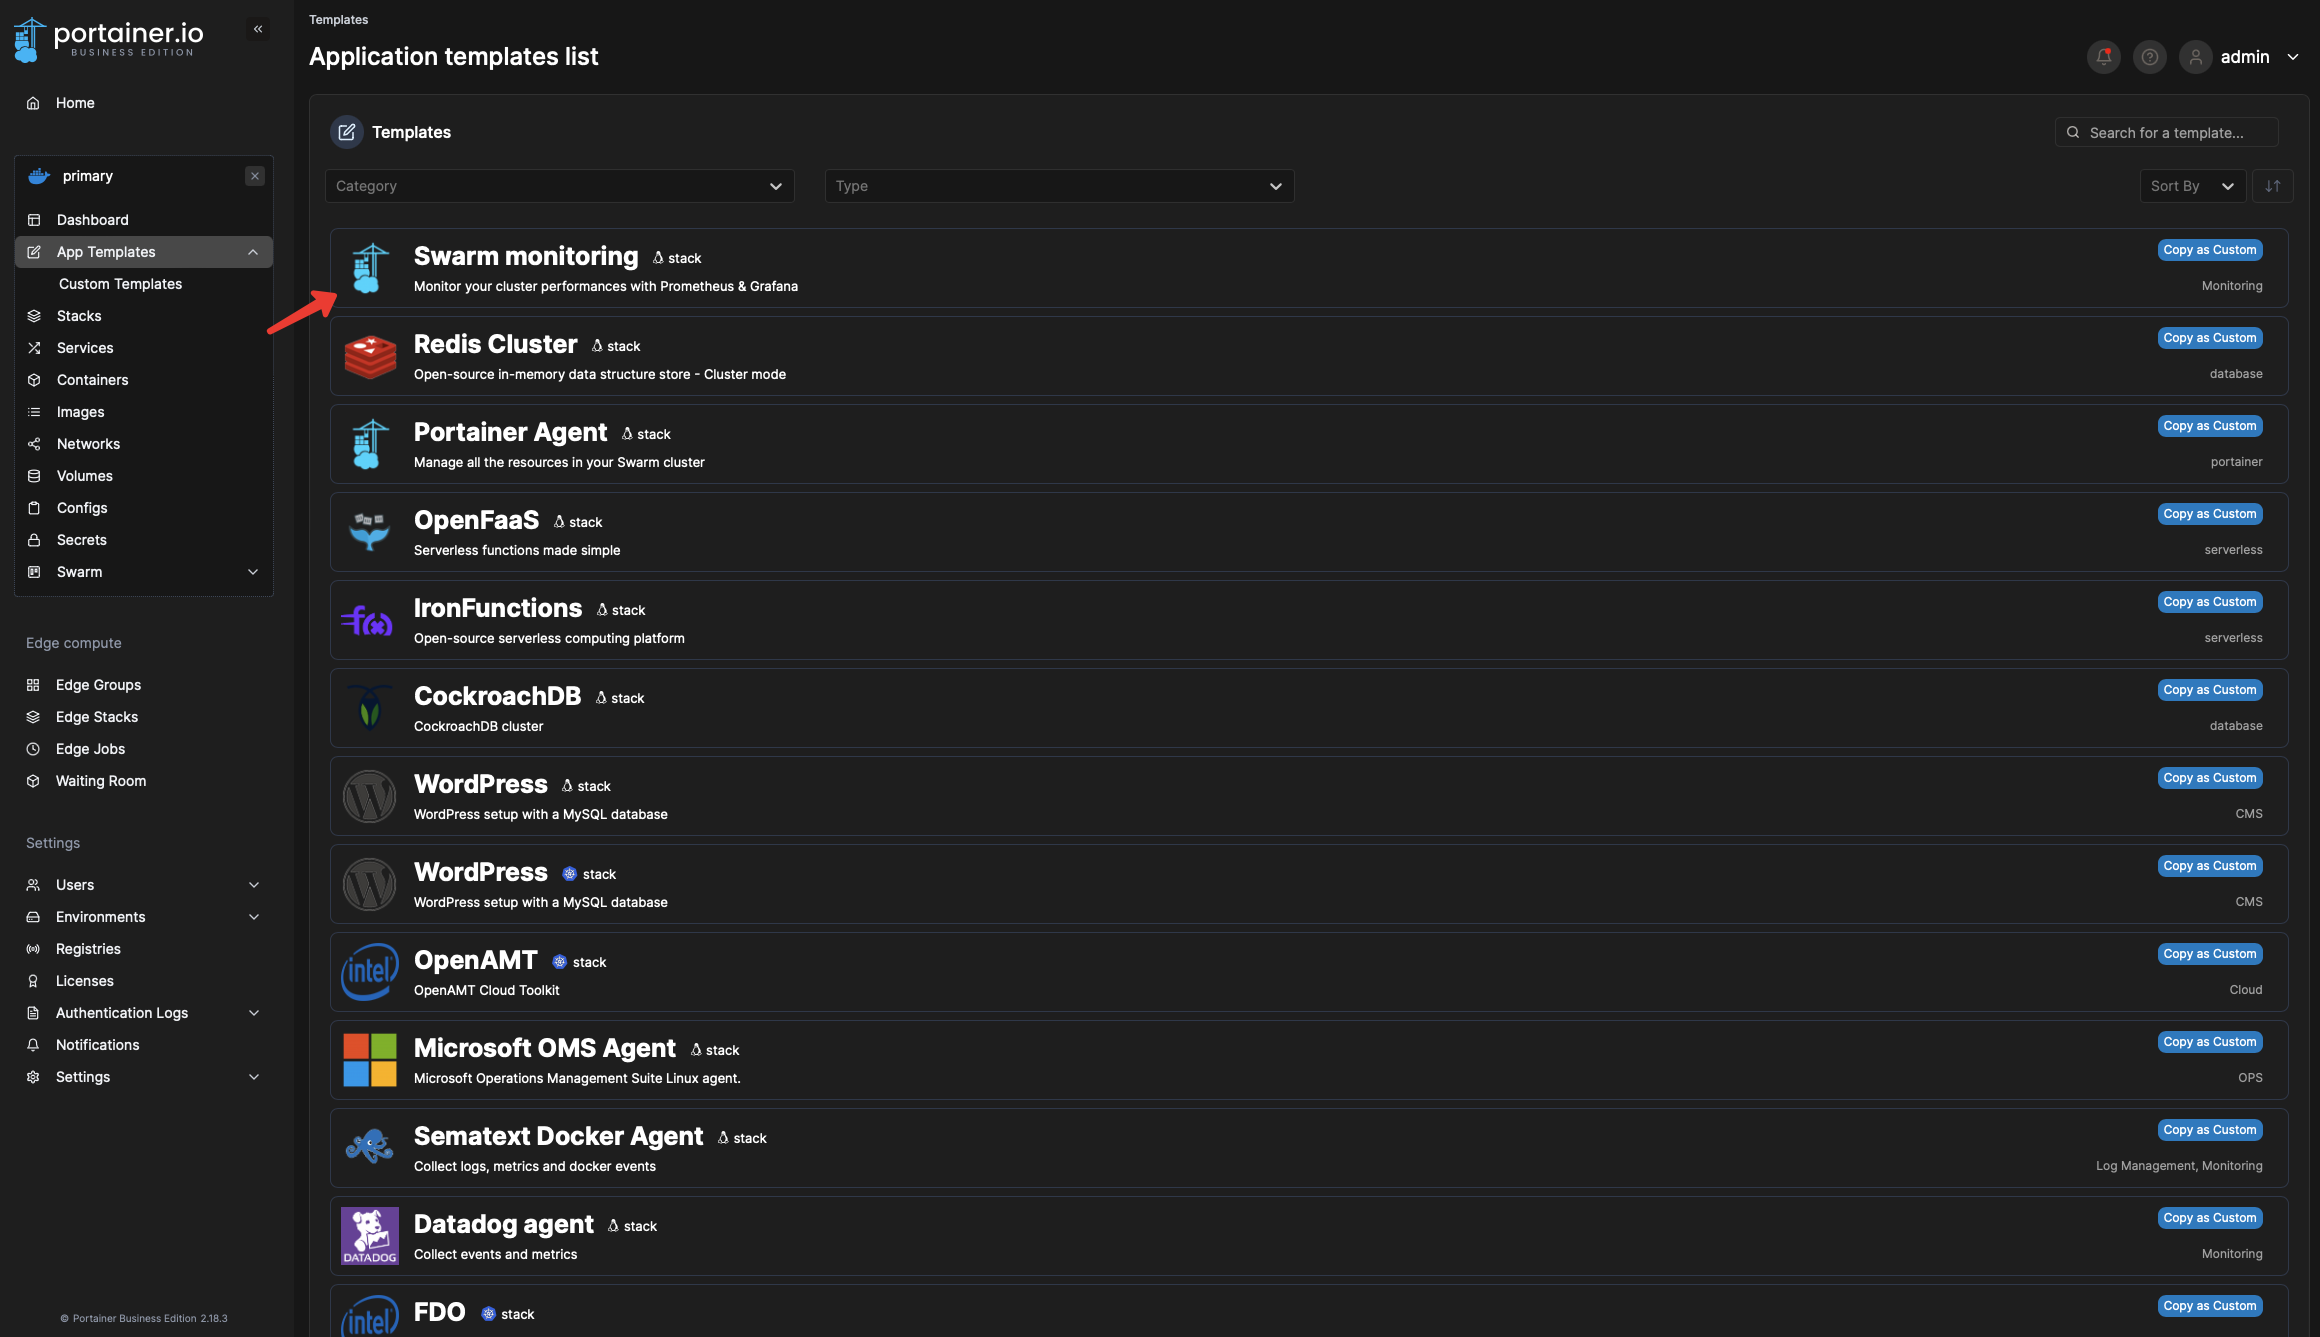
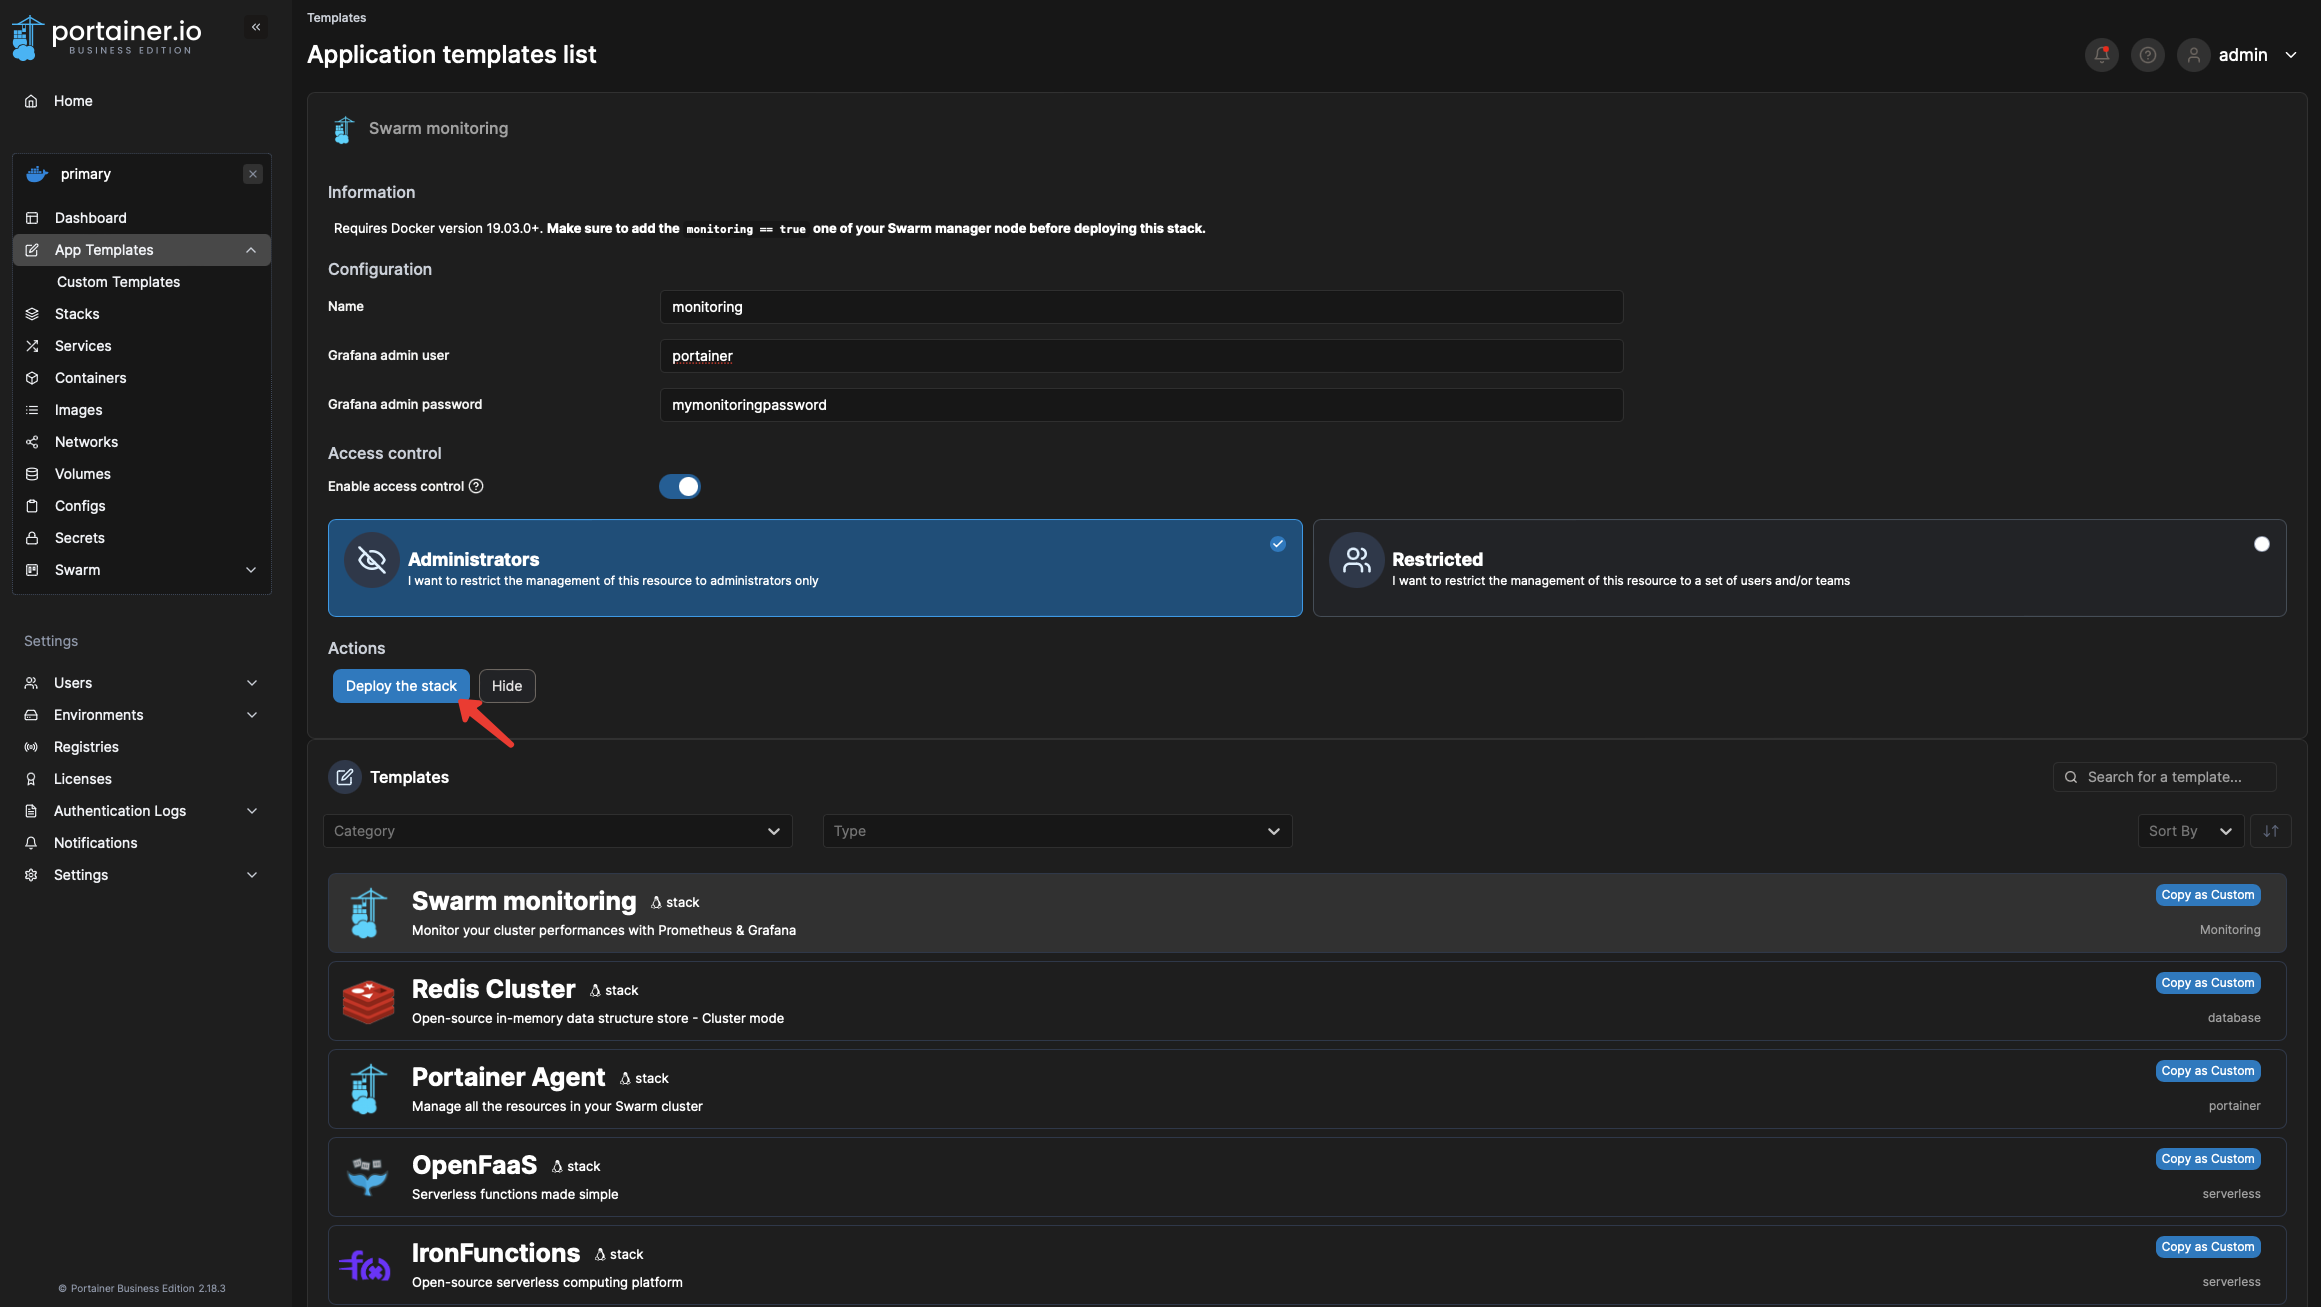
Now that you have checked things, navigate to one of your Docker Swarm environments, then click on "App Templates" and select the "Swarm Monitoring" Template.
Note the requirement in the information section:
Make sure to add the monitoring == true one of your Swarm manager node before deploying this stack.
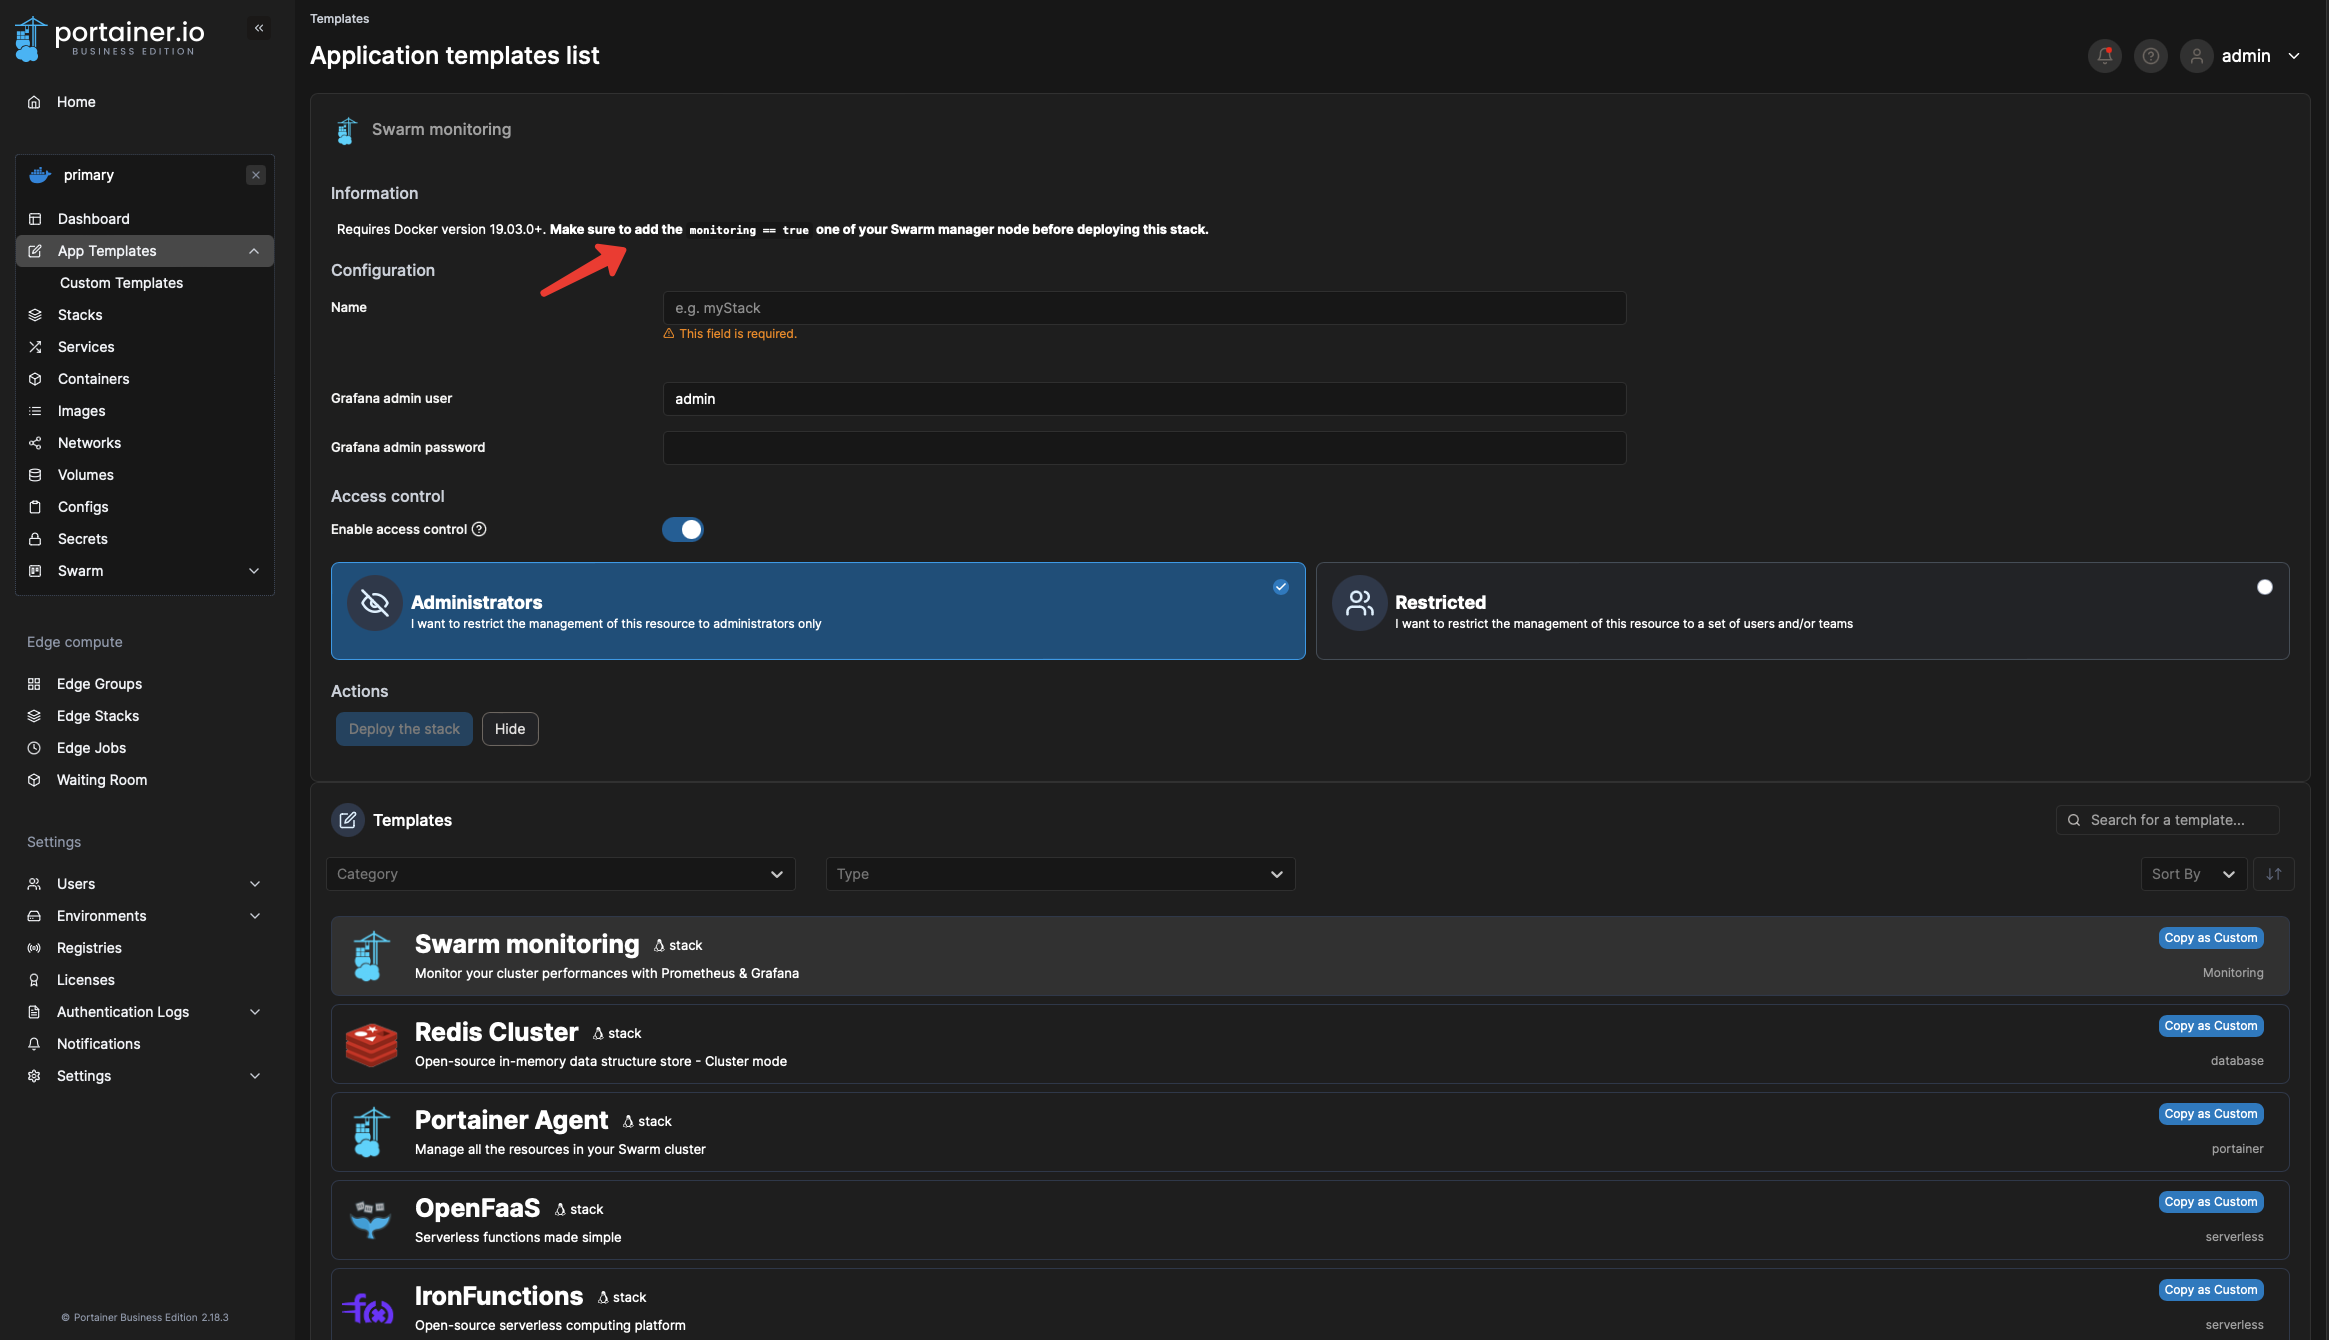
This means that you first need to select which node(s) in your cluster will be available for the deployment of the monitoring stack. This is to ensure that the data is persisted on a selected node so that if your service needs to be redeployed, it will be redeployed on the same node.
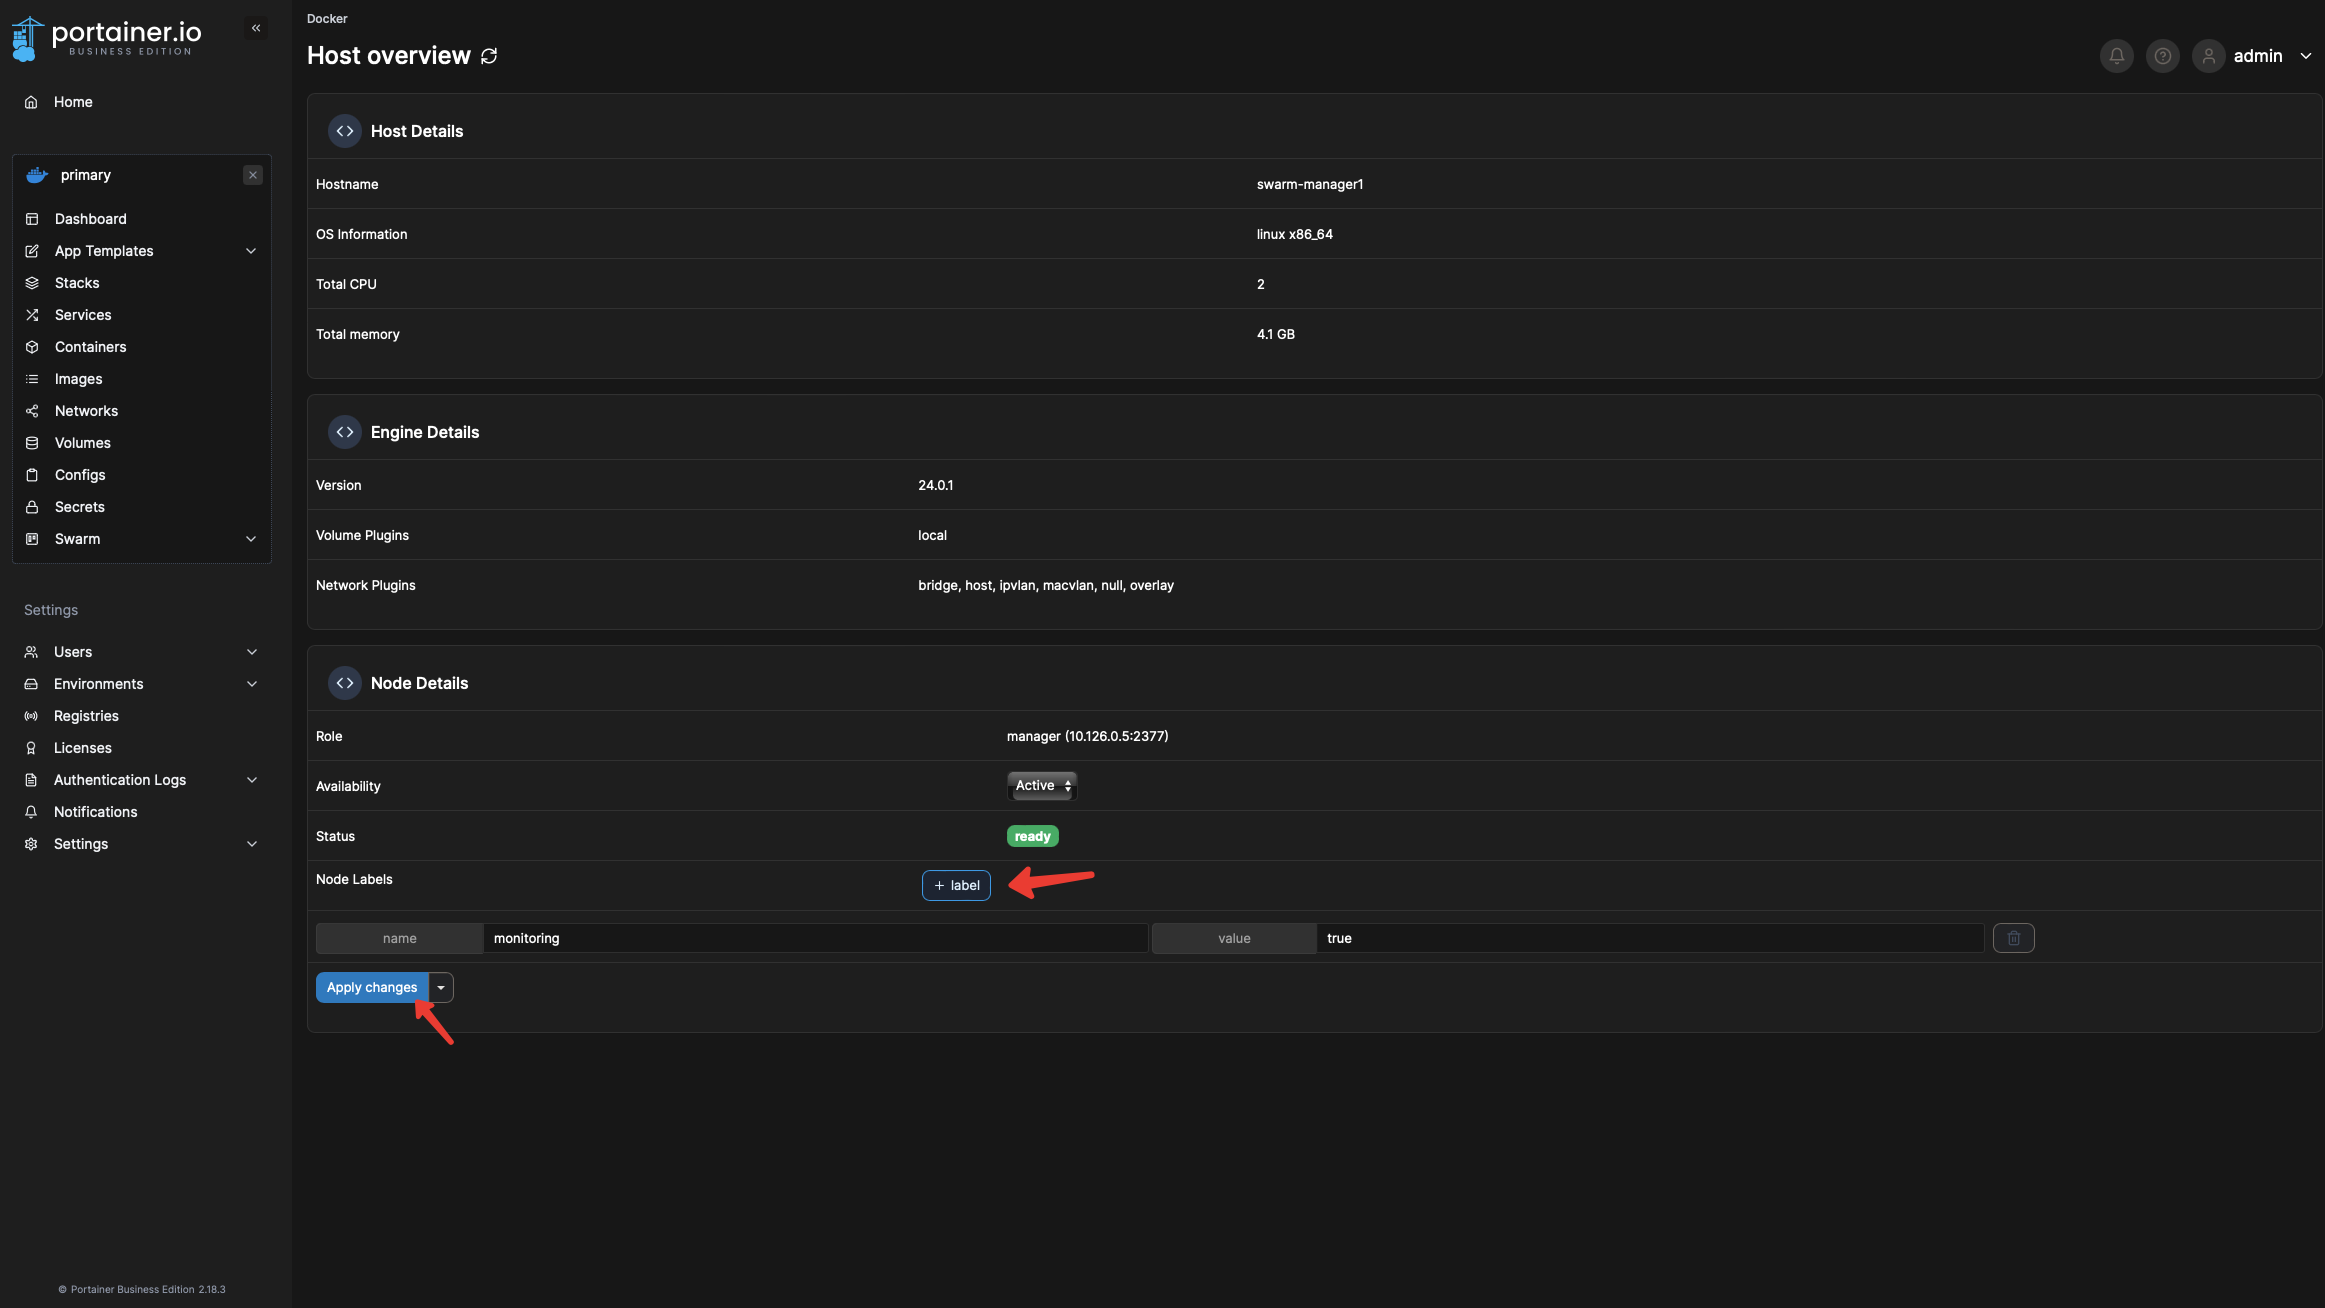
We can do that simply from the Portainer UI by heading to the Swarm menu, then selecting the manager node that we want to use.
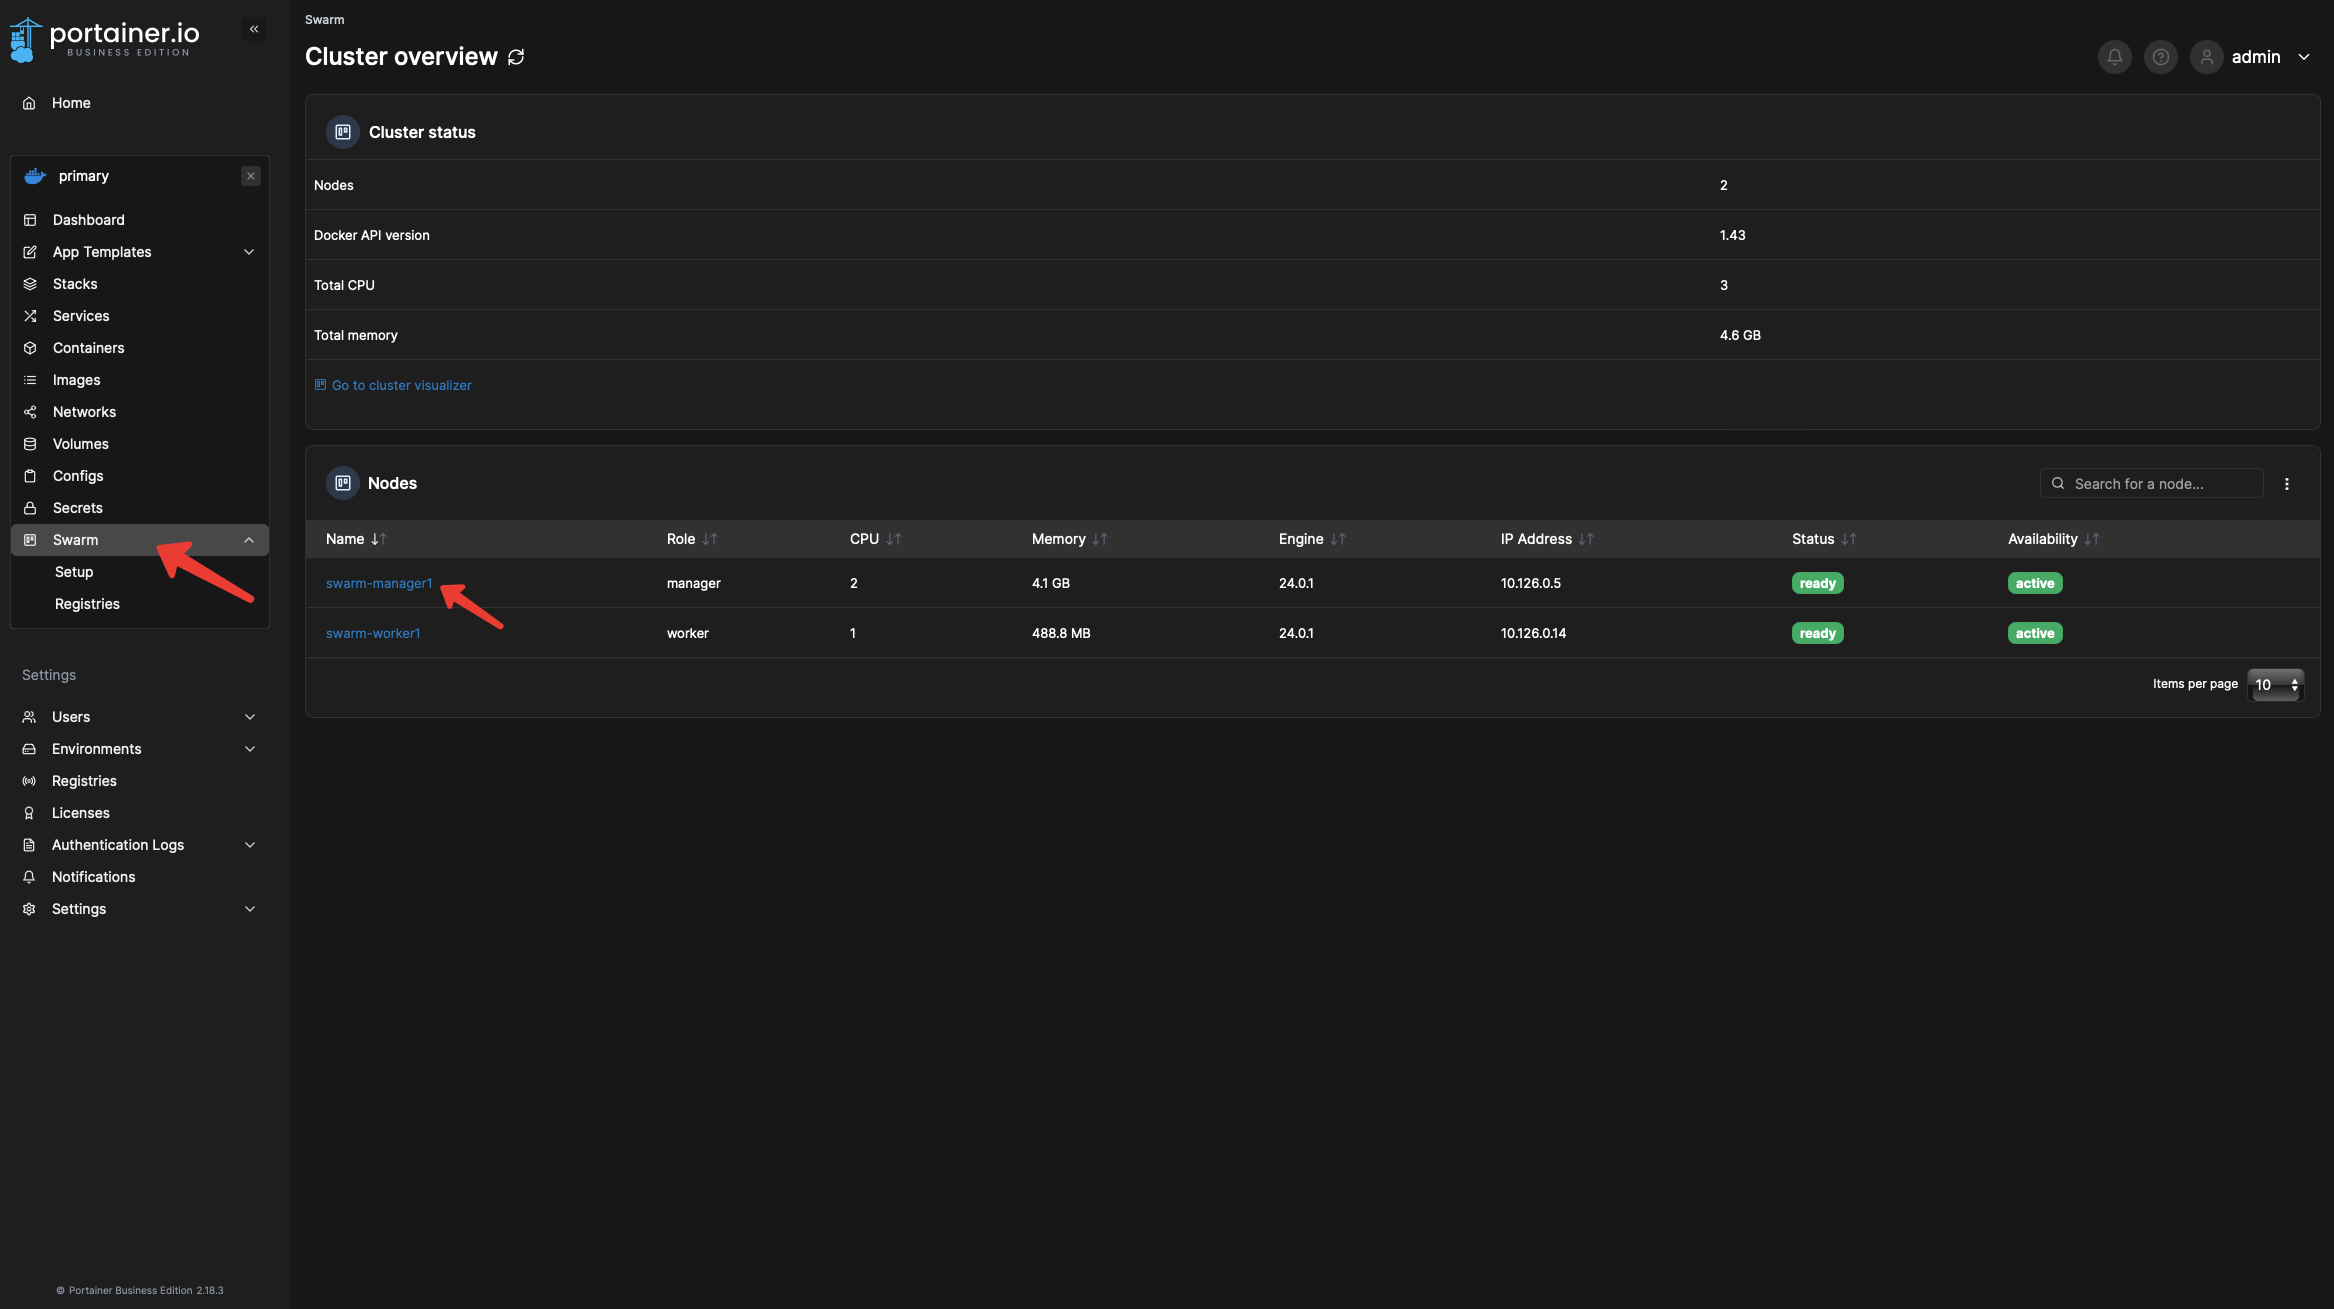
Just add a new label with the name set to monitoring and the value set to true and apply the changes.
You can now head back to the App Templates and deploy the Monitoring stack.
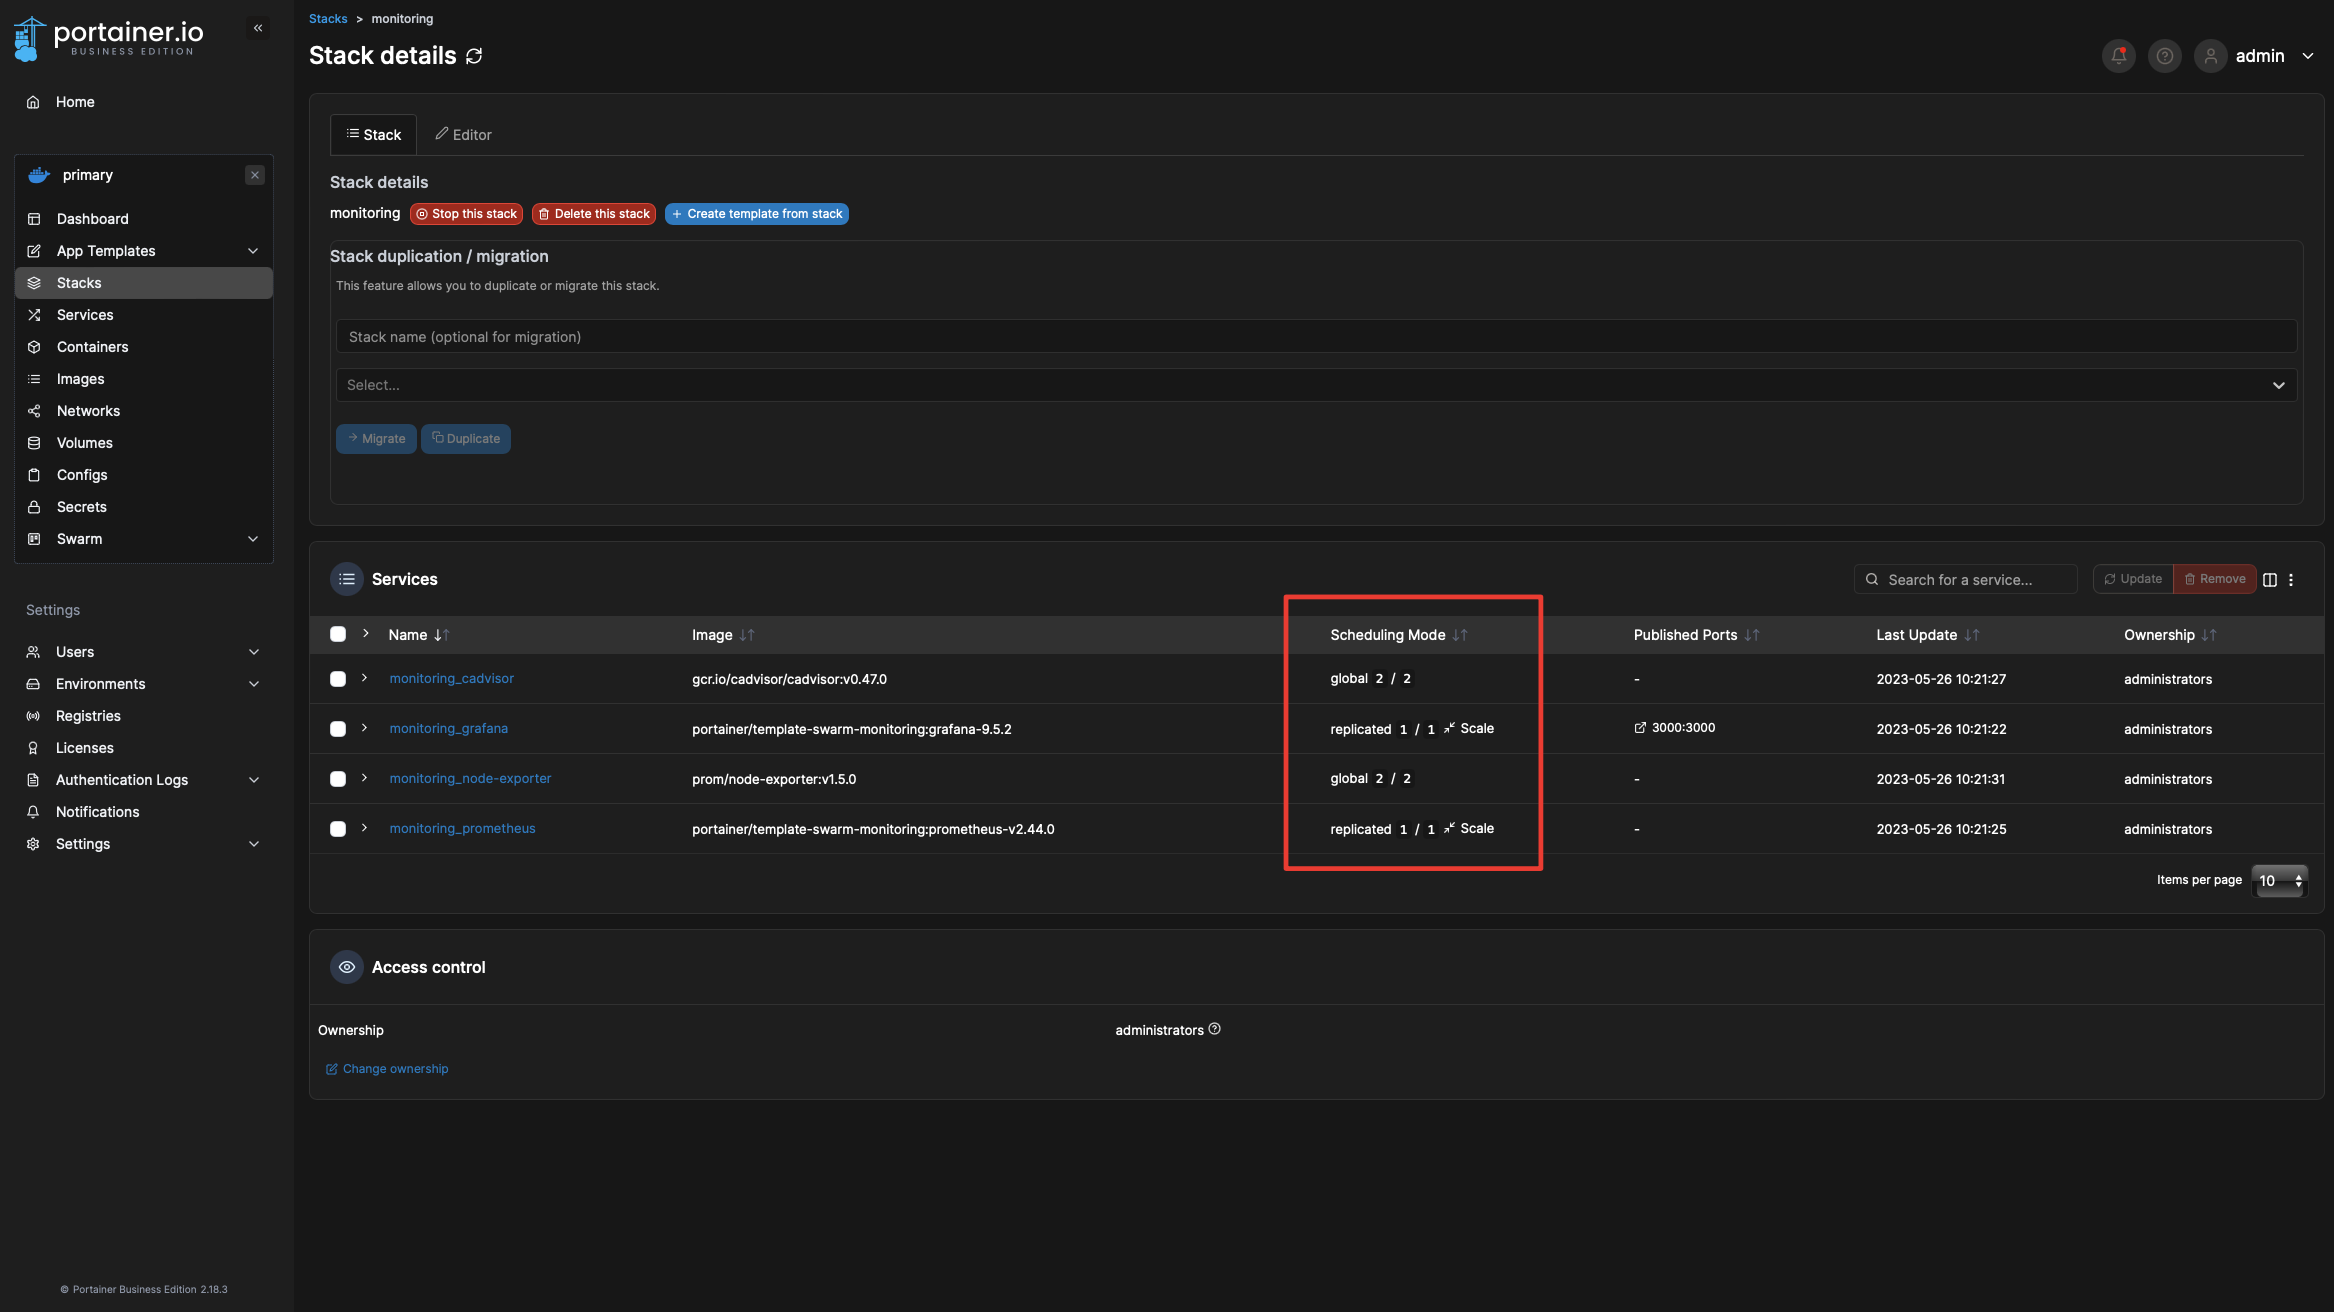
We can then inspect our newly deployed stack and wait for all of the services to be ready.
How to USE the Prometheus and Grafana stack you just deployed...
Once all the services are ready, you can access the Grafana dashboard over the IP of one of the nodes in your Swarm cluster and port 3000: https://swarm-node-ip:3000
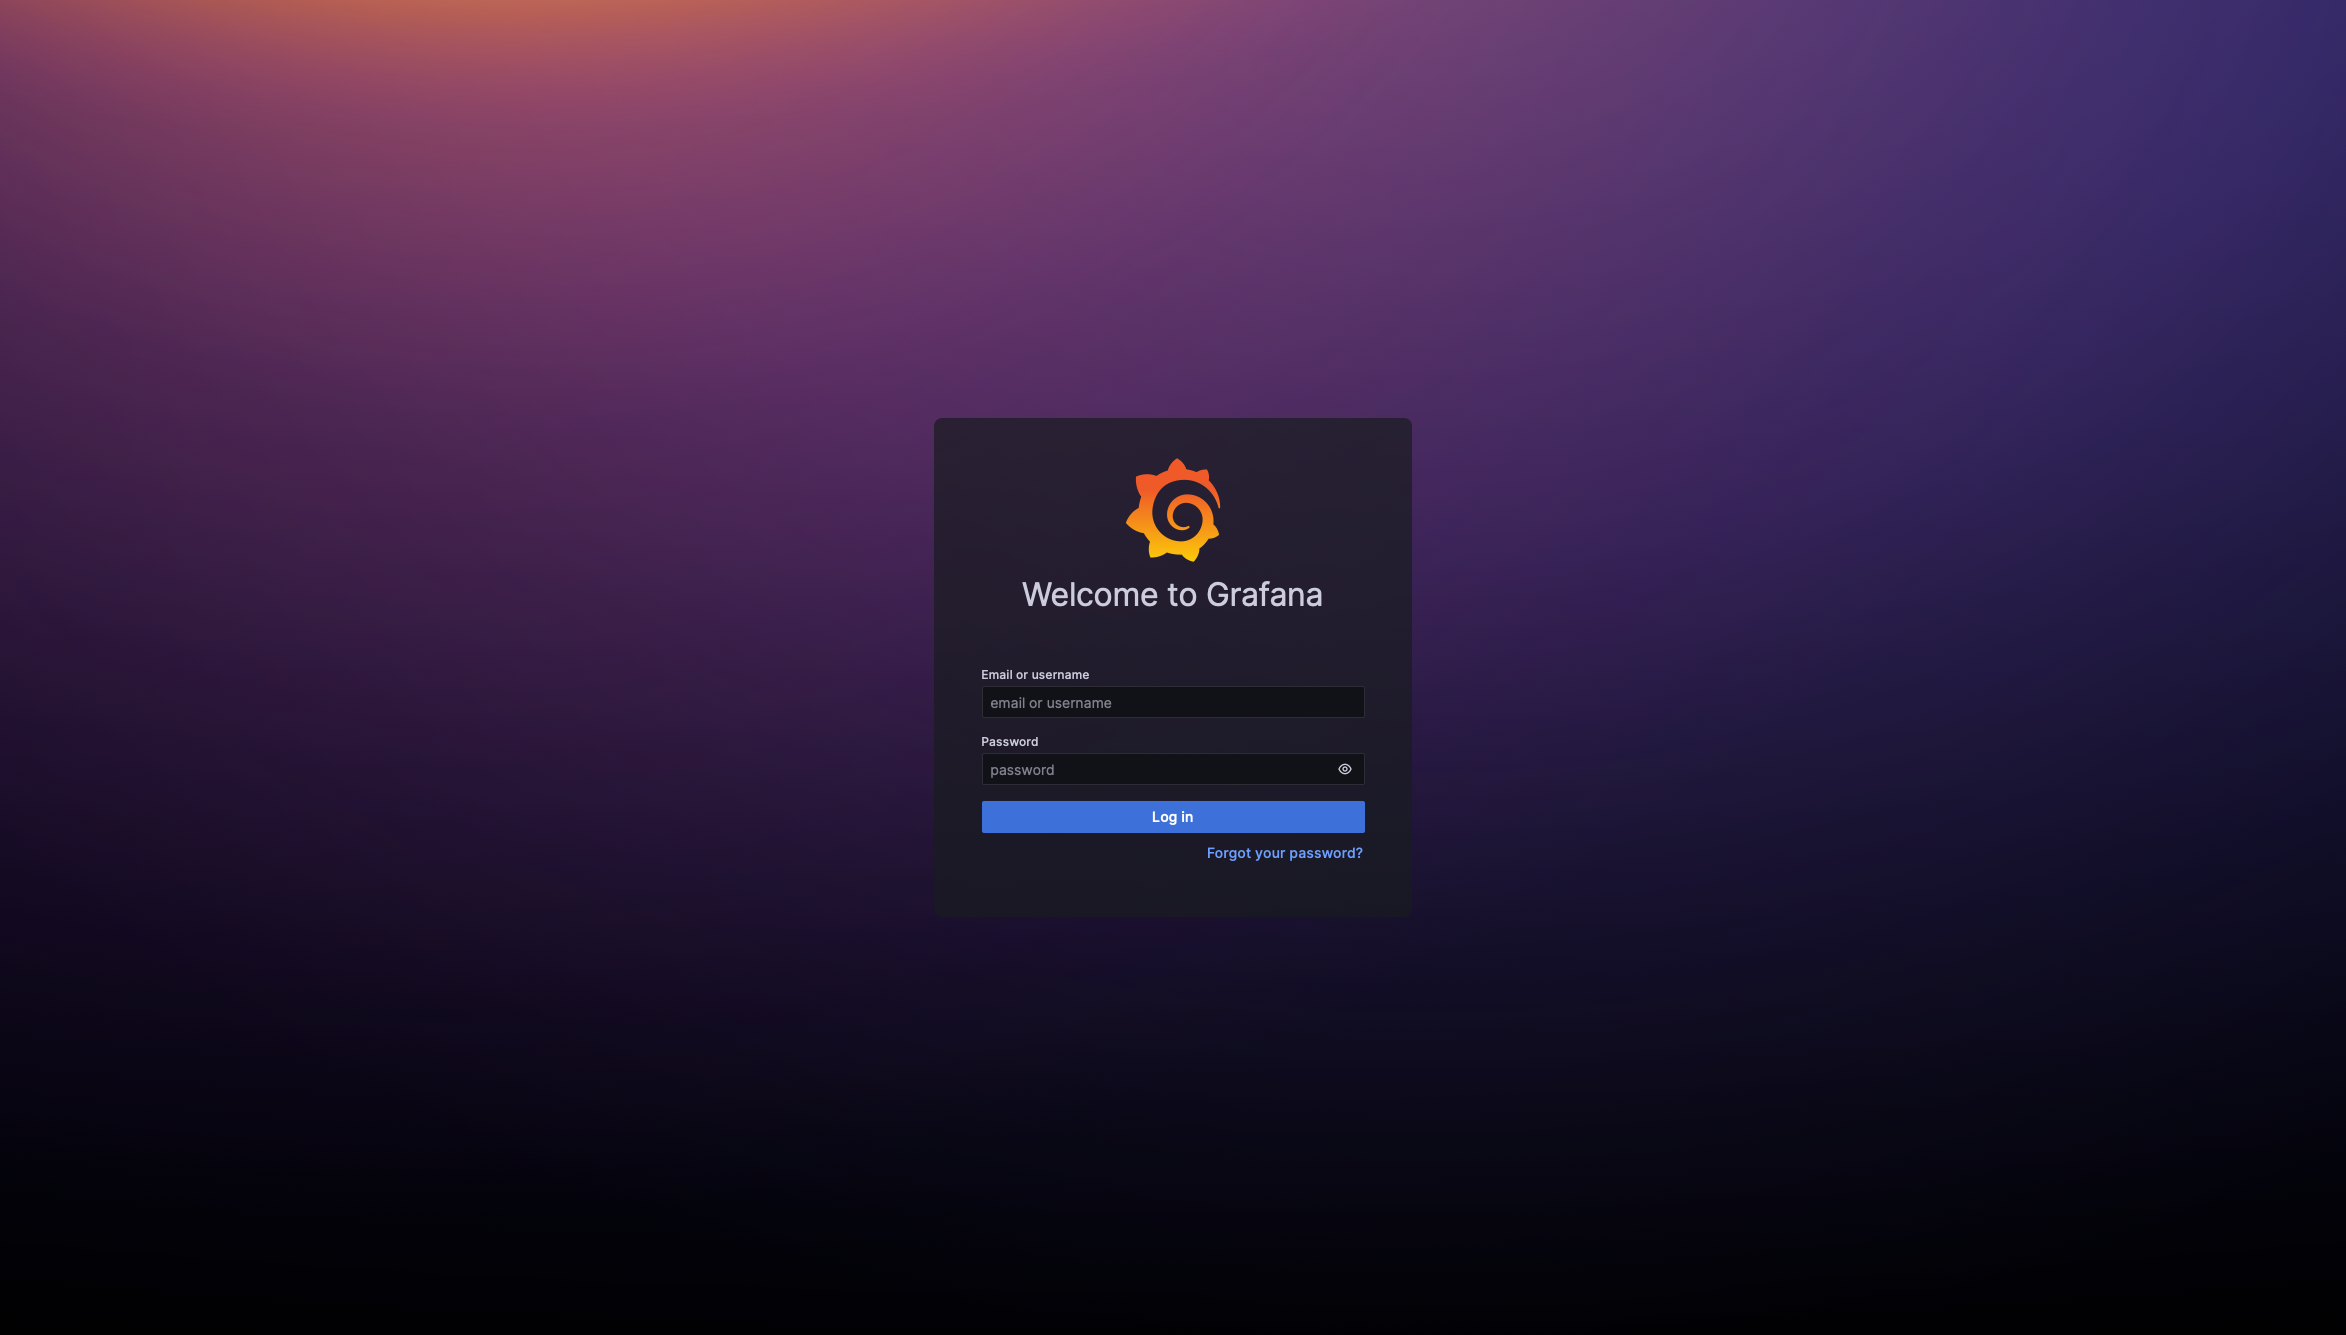
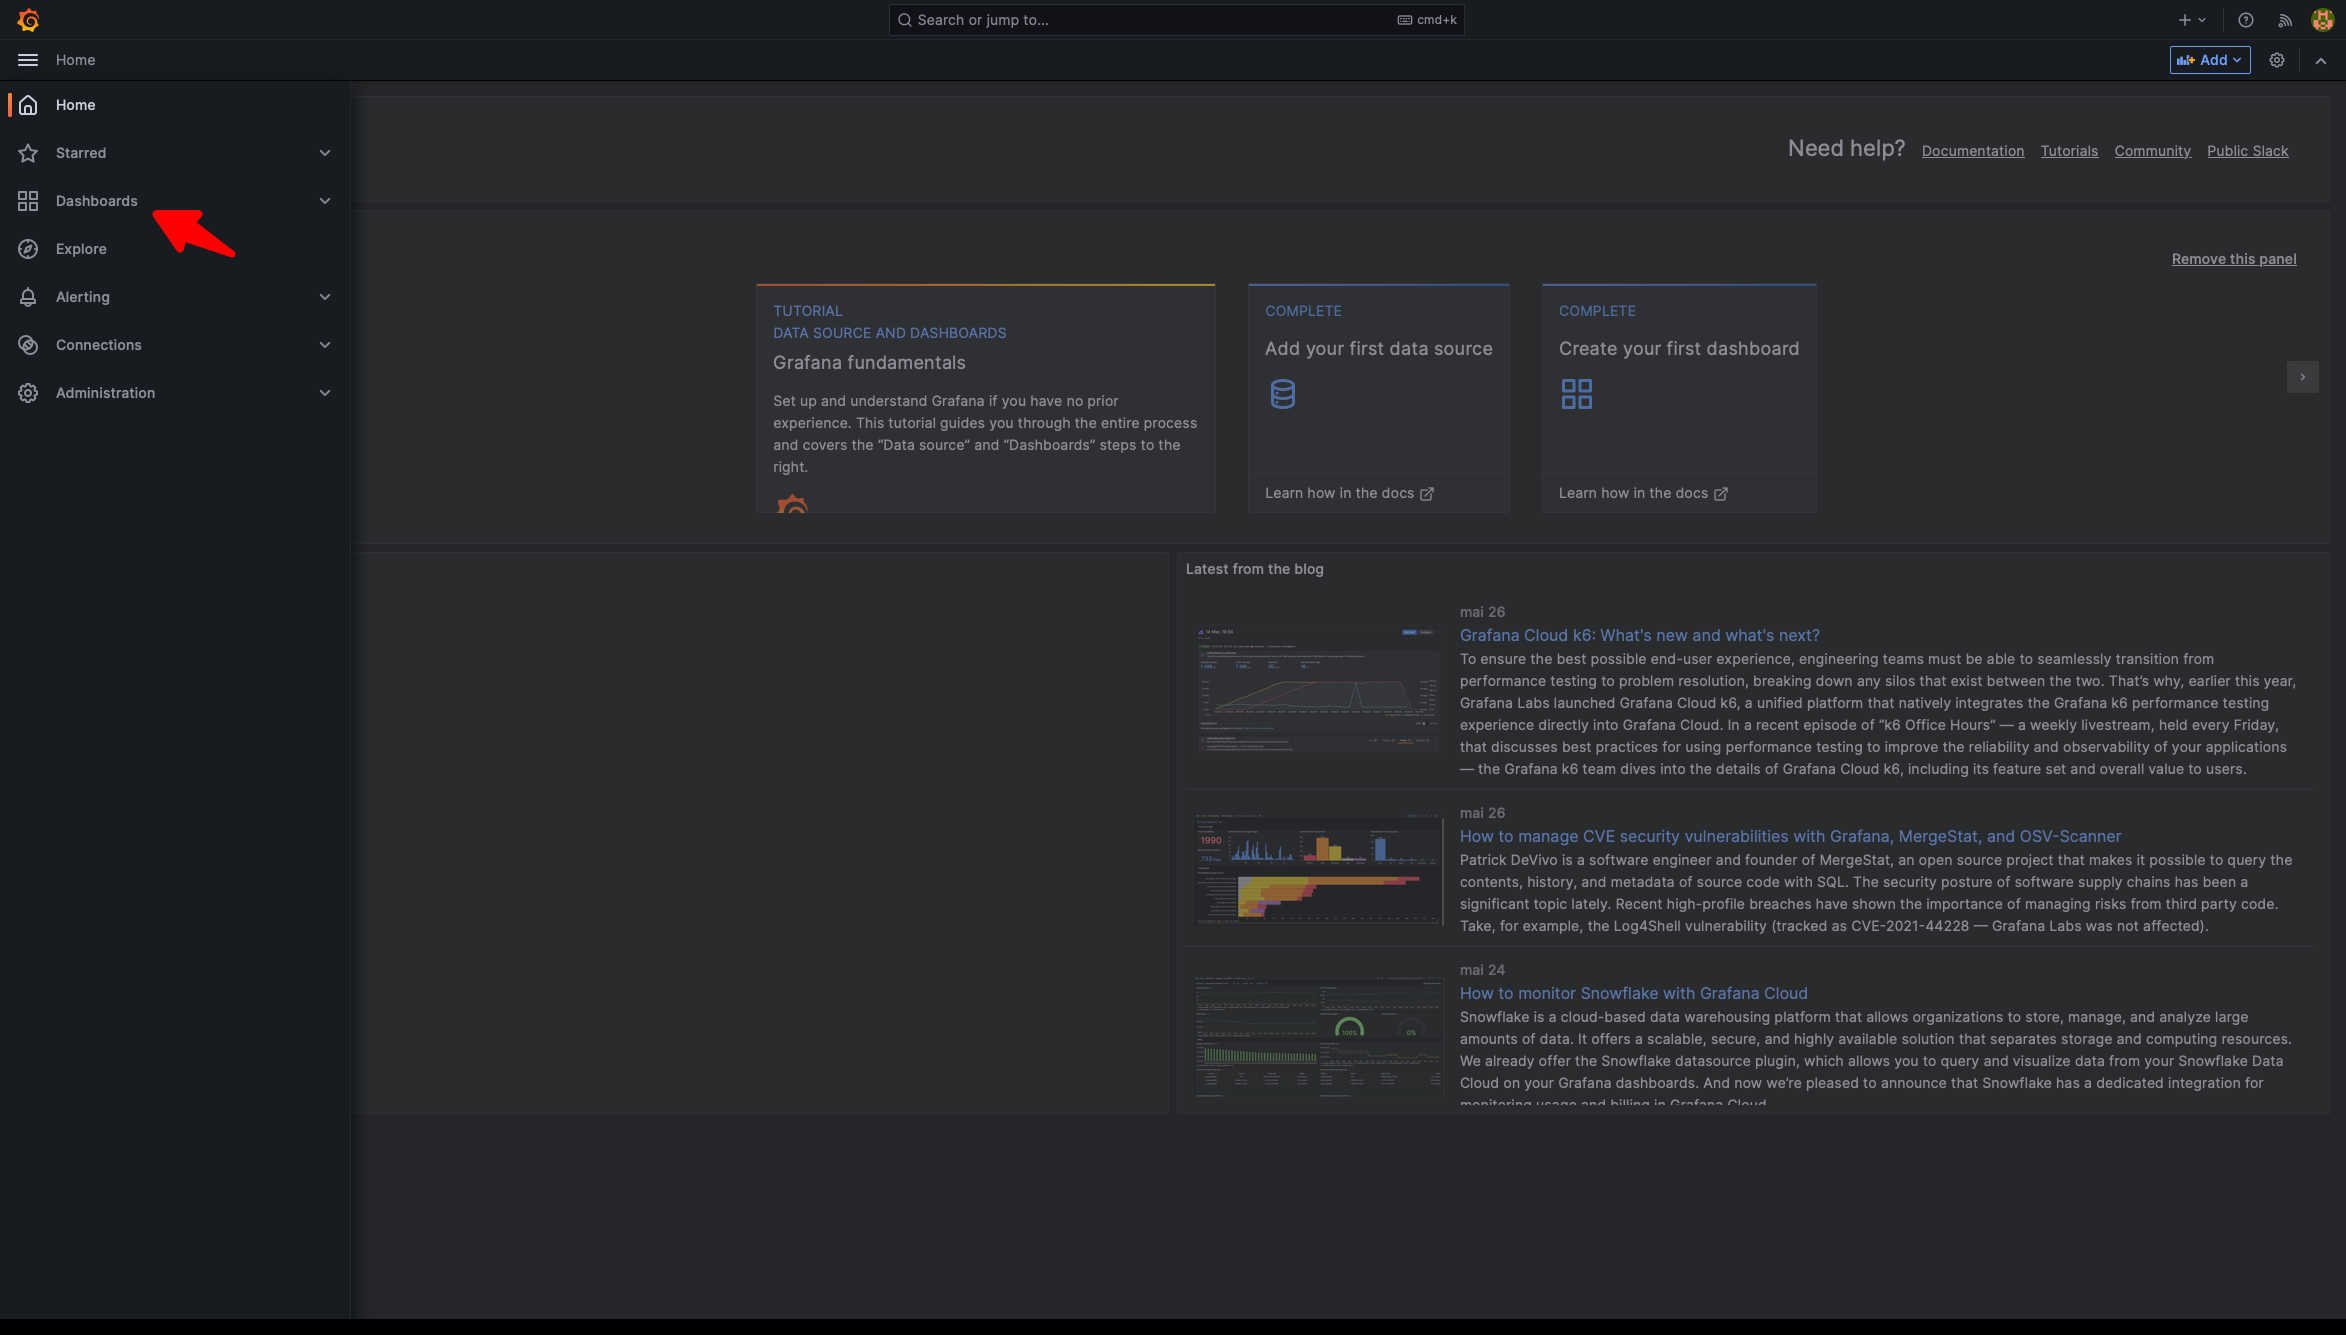
After logging in, you will land on the Grafana homepage. You can use the menu in the top left to access dashboards.
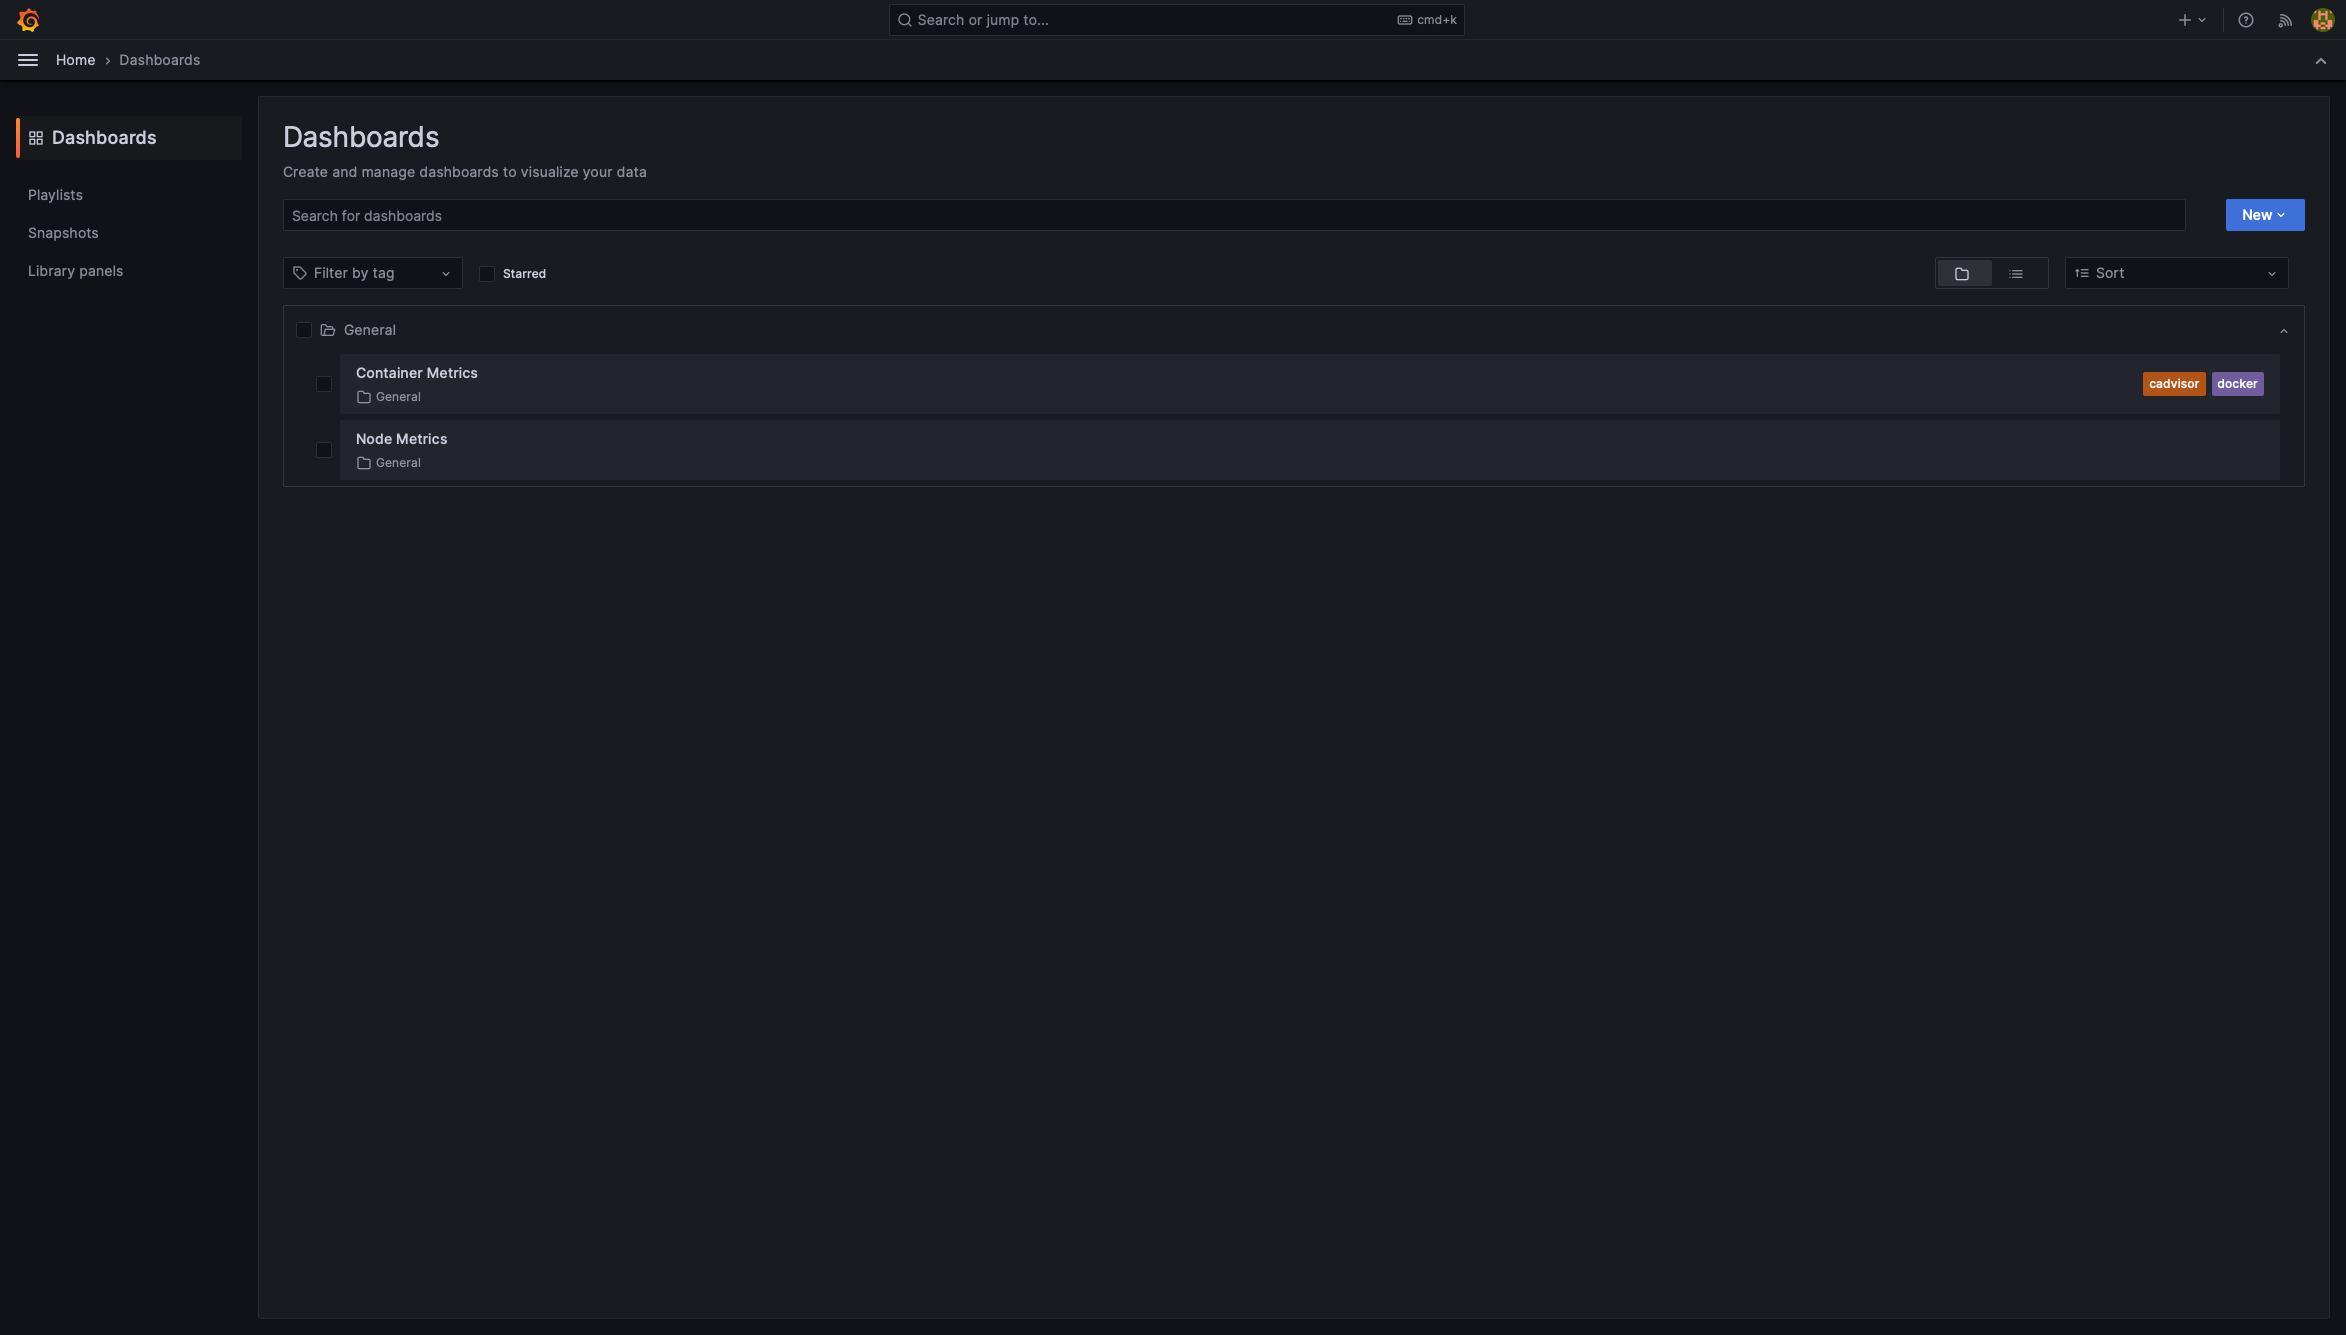
You will then find two dashboards under the General folder.
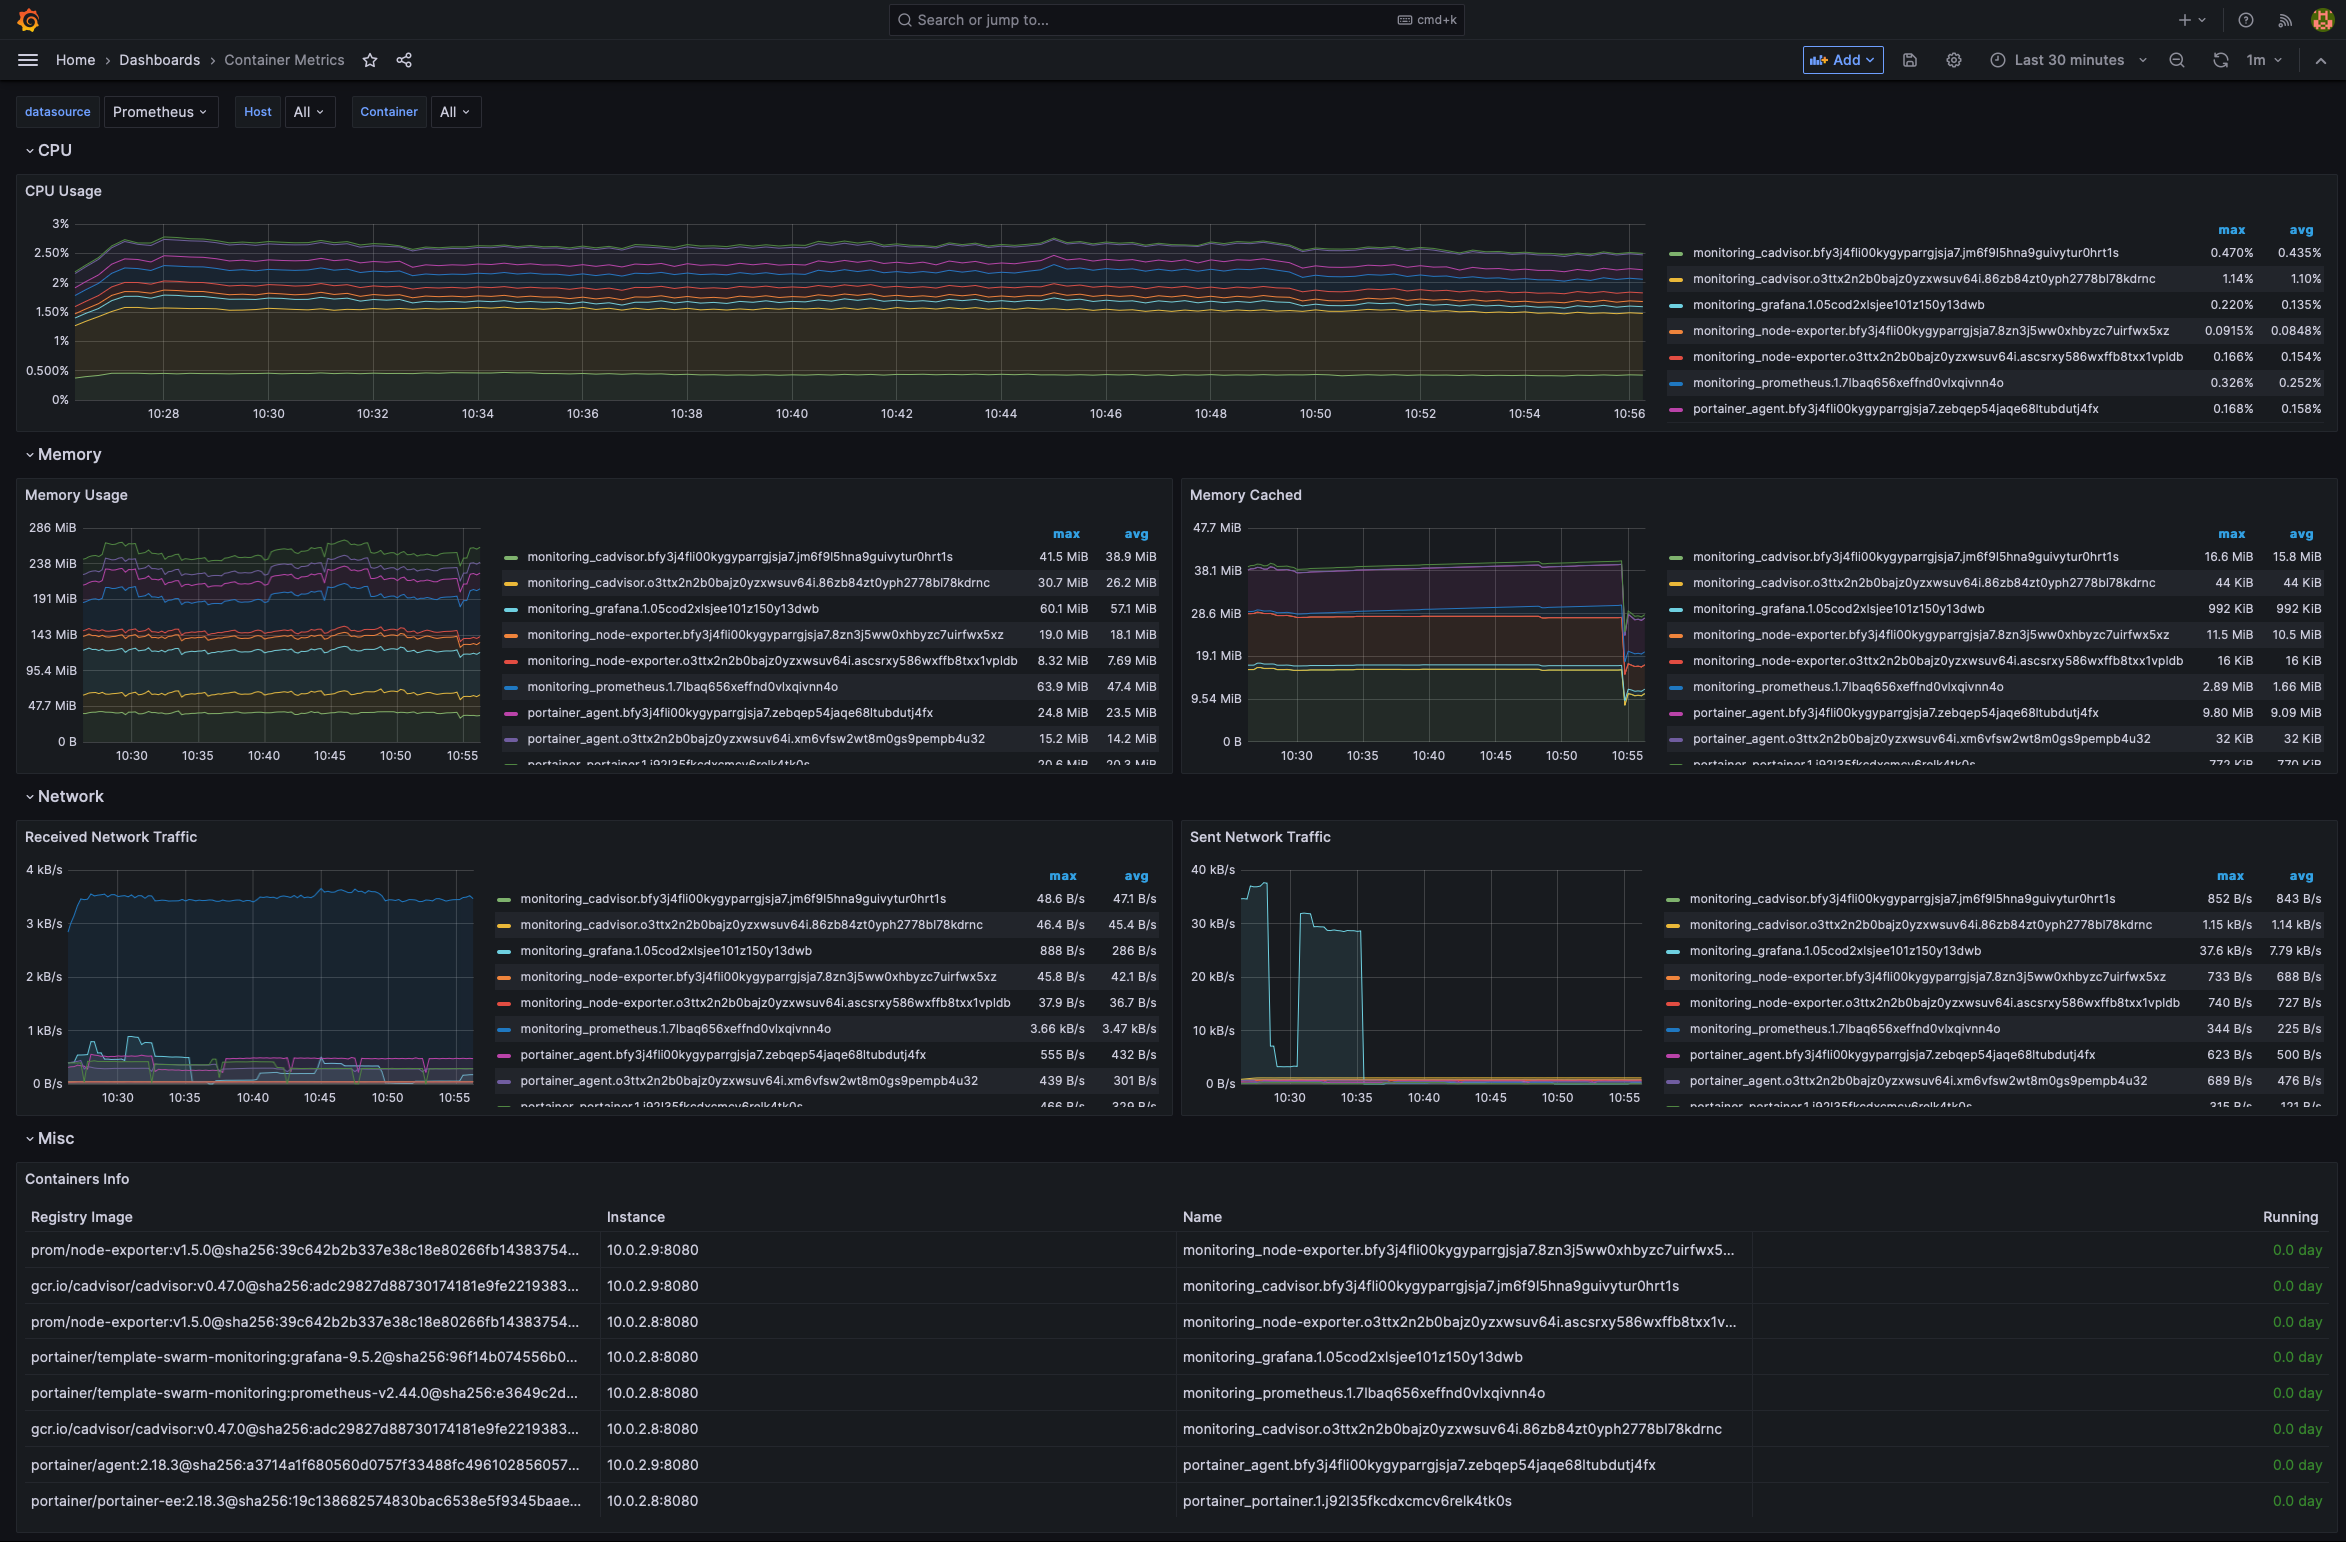
The Container Metrics dashboard provides an overview of the resource usage for all containers in your cluster.
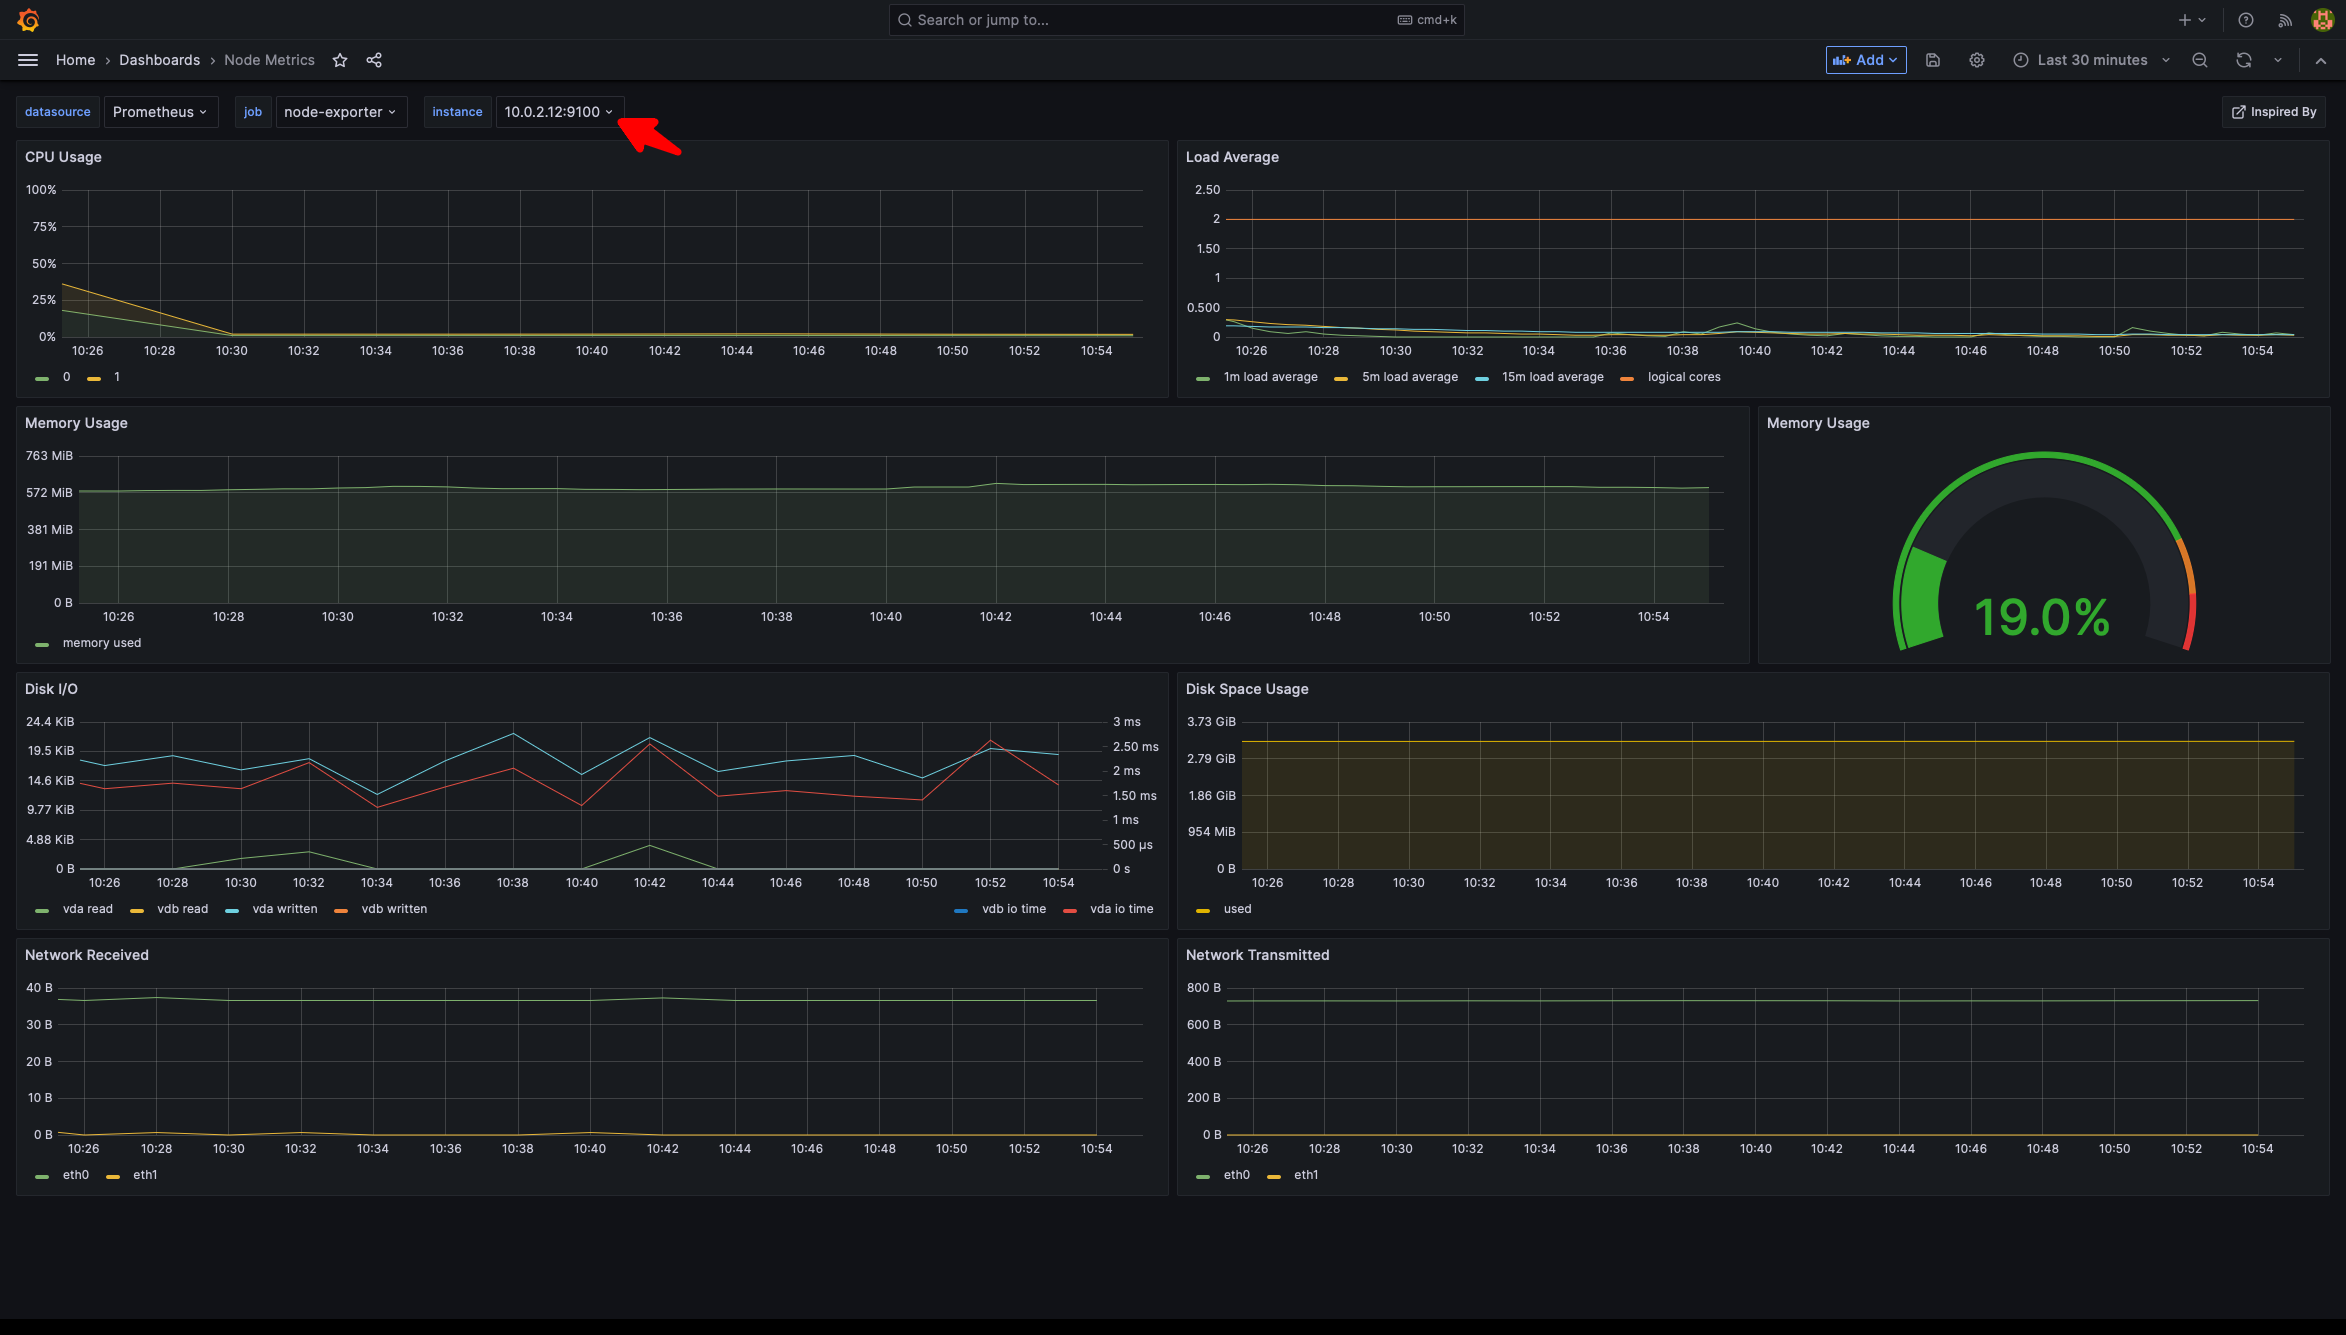
The Node Metrics dashboard provides an overview of resource usage for a specific node in your cluster. You can select the node of interest using the Instance filter at the top of the dashboard.
Conclusion
Monitoring a Swarm cluster is essential to ensure its availability and reliability. By using Prometheus and Grafana to collect and visualize the metrics of the cluster, and by using Portainer to simplify the deployment, you can effectively monitor your Swarm cluster and detect potential issues before they become critical.
You can find more information about how the monitoring stack is configured in our OSS template repository at https://github.com/portainer/templates/blob/master/swarm/monitoring/docker-compose.yml
To understand how the images are built, you can look at https://github.com/portainer/templates/tree/master/images/monitoring
Happy Monitoring..
Try Portainer with 3 Nodes Free
If you're ready to get started with Portainer Business, 3 nodes free is a great place to begin. If you'd prefer to get in touch with us, we'd love to hear from you!


COMMENTS