Share this post
Back in 2017, Kelsey Hightower famously quoted:
"No dev actually wants to use the kubectl command line, but they are forced to due to a lack of visibility. Devs cannot fly blind. Ops, give them tools: curated dashboards that provides them insight as to what's actually happening. Devs want to see the deployment and runtime status of their app, logs, network traces, metrics."
And whilst, under a DevOps model, Devs likely want more exposure to Kubernetes than just a dashboard, the core message remains true. Devs need tools to see what's going on with their apps once deployed.
Portainer is a centrally deployed management platform, that lets Ops provide an intuitive curated dashboard UI to Devs. Portainer allows Devs to safely engage with their applications that run within Kubernetes clusters, without specifically needing to know Kubernetes. Portainer does this by making the triage capability available at the click of a button.
Let's show you how..
One of the most fundamental pieces of functionality needed by Devs is to view the runtime logs of their deployed application, and in Kubernetes speak, this means the Pods that underpin their deployments.
The easiest way to give Devs the ability to view pod logs, without forcing them into kubectl, is via Portainer. We allow any authenticated user (that is granted access to a cluster, and is assigned the right RBAC role) to inspect the logs of running Pods, including filtering/searching within the logs, downloading the logs to their PC, and viewing logs within a certain time window.
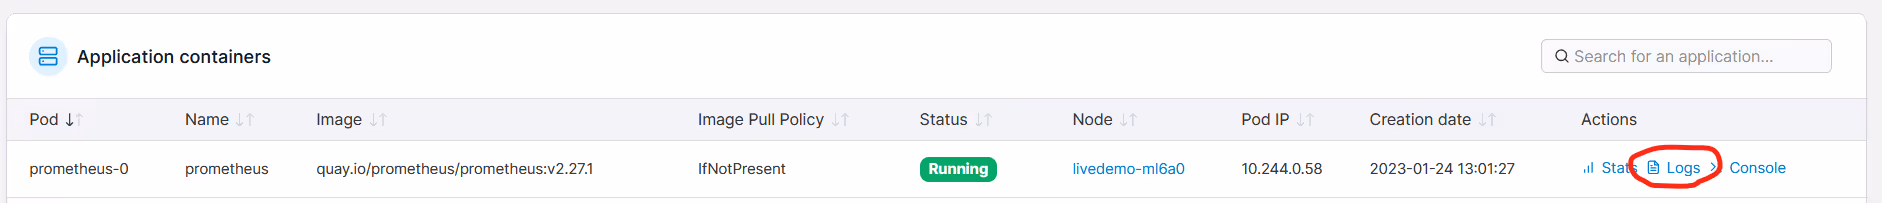
You simply click the "Logs" quick action, and you are connected to a live stream of the Pod logs.

The second fundamental piece of capability is to open a console into a running Pod, to get a deeper understanding of what the application within that Pod is doing, and/or to inspect Pod filesystem elements.
Again, Portainer makes that easy.
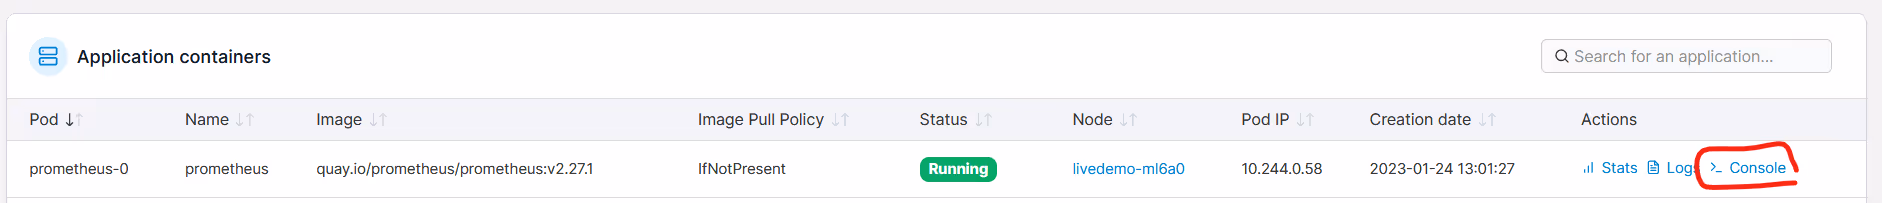
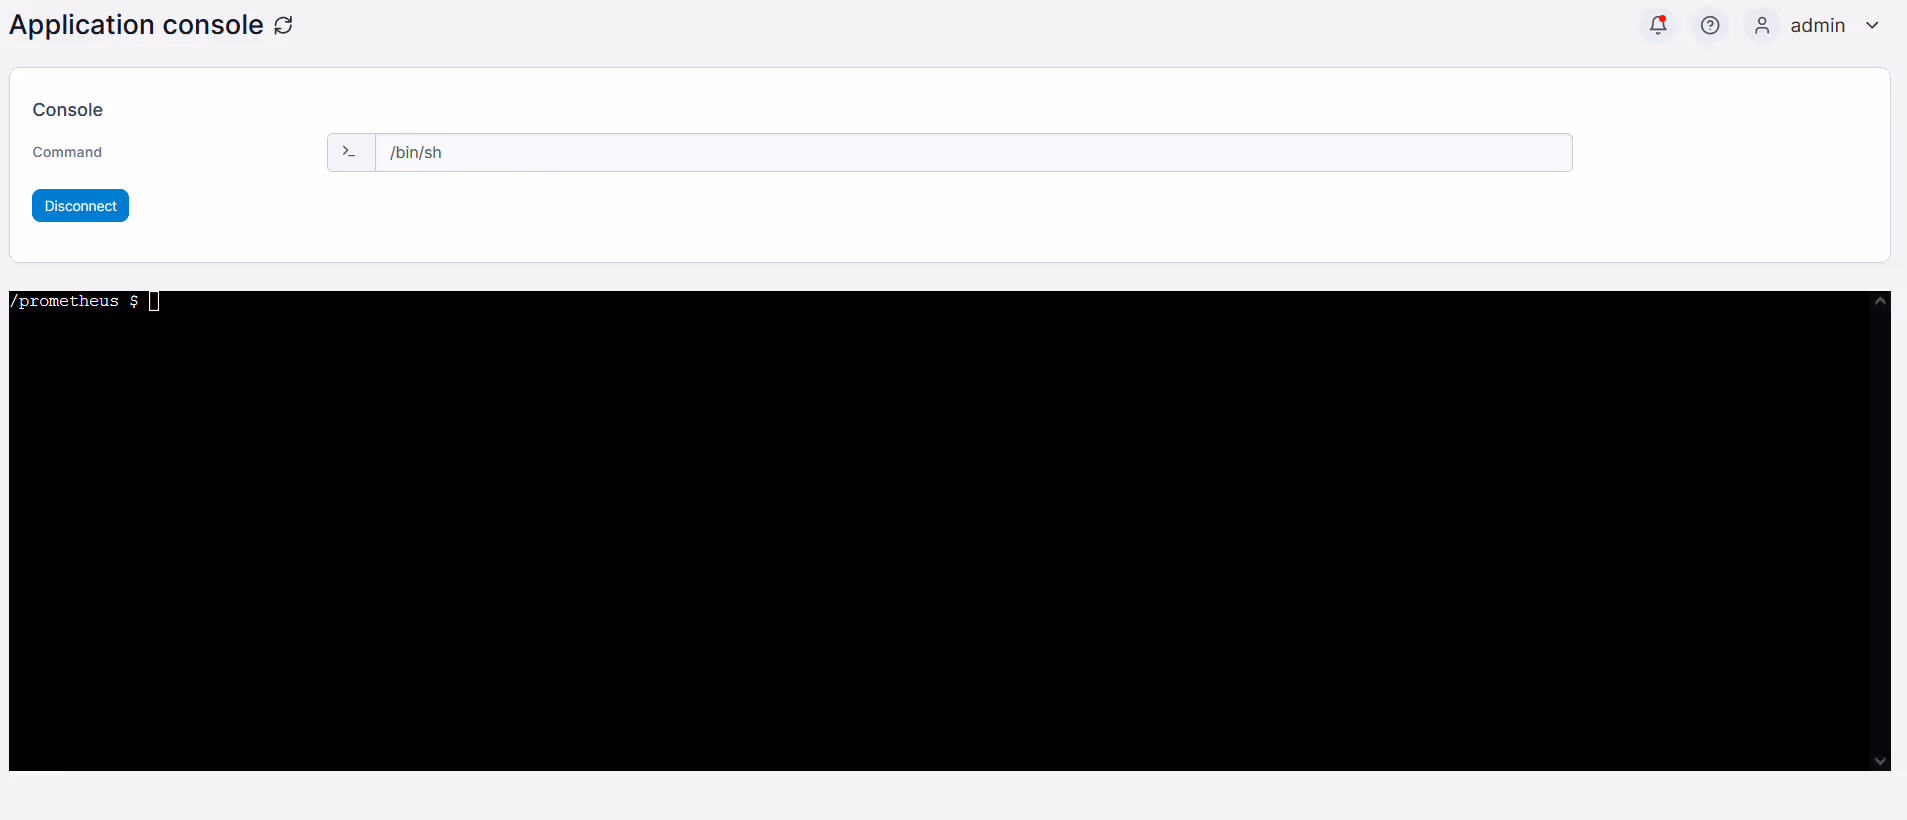
You simply click the "Console" quick action, and you are connected to the console of the Pod.
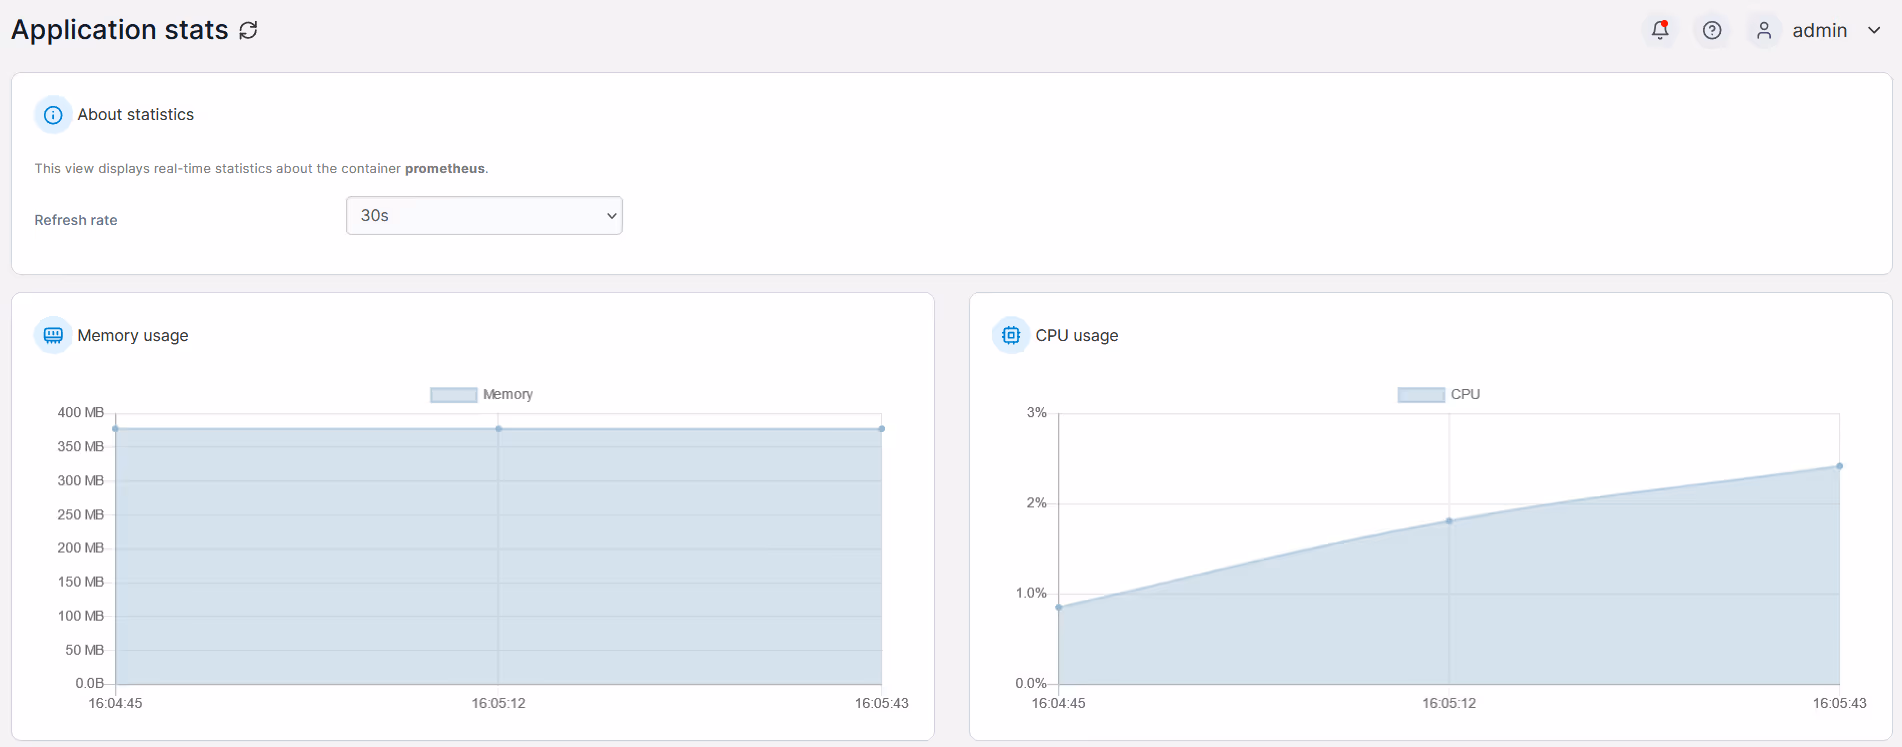
And the final fundamental capability is to be able to see stats/performance of the Pod.
Portainer integrates with the Kubernetes Metrics API (either from Metrics server, or Prometheus-adapter) to pull CPU and Memory usage data for the Pod.

You simply click the "Stats" quick launch to see the metrics being generated for the selected Pod.
So as you can see, once you have Portainer installed in your environment, Devs can be given access to Pod Stats, Logs, and the Console, all without needing to install anything on their PC, or needing to know how to operate the KubeCTL CLI.
This is just the tip of the iceberg into the curated dashboard capabilities of Portainer, but as these three are the most fundamental requirements of any Dev, it's important to see how quick and easy it is for Ops to provide this safely to Devs.
Try Portainer with 3 Nodes Free
If you're ready to get started with Portainer Business, 3 nodes free is a great place to begin. If you'd prefer to get in touch with us, we'd love to hear from you!
Neil