Share this post
When industrial systems scale, visibility is often the first thing to break. You’re managing more sites, more edge devices, more software, and fewer chances to get it wrong.
An IoT device management dashboard gives you a single place to see what’s running, what changed, and where risk is building, before downtime or inconsistency shows up on the factory floor.
This guide explains the features that matter most in an IoT device management dashboard, especially in industrial/edge environments, how to set one up, and examples to learn from.
The Importance of IoT Device Management Dashboard
An IoT device management dashboard is an operational visibility and control interface that provides a centralized view of distributed IoT and industrial-edge devices.
It isn’t about raw telemetry analytics or dashboards showing sensor graphs; it’s about knowing what is running, where it runs, and whether it meets operational standards. This visibility matters in large, distributed environments where devices and workloads span factories, plants, or remote sites.
Effective dashboards help maintain governance, consistency, and uptime across fleets of devices and workloads, reducing blind spots and manual processes that don’t scale. Adopting a structured approach to fleet device management is essential to achieving this level of synchronized operational control.
For example, an established US manufacturing company struggled to scale containerized workloads across dozens of plants. Then, they implemented a management layer (Portainer) that enabled one-click deployment, eliminated repetitive command-line operations, and ensured error-free rollouts.
Here’s what an IoT device management dashboard supports in practice:
- Central view of distributed devices and workloads
- Real-time status and health tracking
- Consistent policy and access governance
- Better decision-making for scale and risk
What Should an IoT Device Management Dashboard Include?
Think of this as a practical on-screen checklist. These are the elements operators rely on daily to maintain visibility, control, and consistency across industrial and edge environments.
Fleet-Wide Visibility at a Glance
You need an IoT device management dashboard showing what is running and where across all sites. This single screen replaces spreadsheets and manual checks that break at scale.
For instance, the New York City Department of Transportation (NYC DOT) implemented an IoT system with cellular routers at 14,000 intersections. This system provided city-wide visibility into traffic flows and incidents from a central dashboard.
This level of visibility makes it easier to spot issues before they cascade across locations. It’s a crucial element in enterprise container operations, especially as environments grow.
Workload and Application State
Without workload state monitoring in IoT dashboards, you’ll need to rely on manual troubleshooting for issues like connectivity drops or battery drain in remote sensors.
A useful management dashboard shows:
- Running, stopped, and failed workloads
- Restart frequency and error states
- Version mismatches between sites
Silent workload failures on edge devices cause longer downtime than hardware faults because they go unnoticed. Central workload visibility closes that gap.
Security and Access Visibility
The Mirai botnet, still one of the largest IoT security attacks, validates why an IoT monitoring dashboard should have security and access visibility.
The hacker attacked OVH (a French web hosting service) using a botnet to consume nearly 1 terabyte of bandwidth per second. This security breach happened because the company had unsecured IoT devices.
You should be able to see who can access what, and where enforcement applies. That’s why security visibility in a management dashboard gives you the control to detect or deactivate compromised IoT devices.
Specifically, it should provide:
- Role and access summaries
- Environment-level permissions
- Policy enforcement status
Policy and Configuration Consistency
In industrial environments, small configuration differences across sites cause real outages. A useful dashboard makes those differences visible. It shows where environments drift from approved standards, which sites run exceptions, and which changes need review.
This feature matters when tens or hundreds of locations operate without local IT staff. Clear policy visibility reduces surprises, shortens troubleshooting, and keeps operations consistent as fleets grow.
{{article-cta}}
Lifecycle and Operational Awareness
You need to see how devices and workloads change over time, not just their current state. A strong dashboard shows when deployments occur, which systems were updated, and which devices are no longer active.
This visibility helps you plan changes without disrupting production. It also prevents outdated workloads from running unnoticed, which often becomes a security and stability risk at scale.
So, how do you create one for yourself or your team?
How to Set up an IoT Device Management Dashboard
Setting up an IoT device management dashboard involves operational decisions about visibility, control, and scale in industrial environments. Let’s have the practical steps:
Define Who Needs Visibility and Why
Map the dashboard to real decision-makers, not abstract personas. In industrial environments, operators, platform engineers, security teams, and external partners all need visibility, but for different reasons. When a single dashboard tries to answer every question, it usually answers none well.
If you run large industrial deployments, separate operational visibility from governance oversight early. This action allows your operators to react to failures quickly while platform teams maintain control over standards and access.
Dashboards designed around roles reduce noise and shorten response time as fleets grow.
Design for Fleet Scale, Not Single Sites
A common mistake is building a dashboard around individual devices and then attempting to scale them. Plan for hundreds or thousands of distributed devices from the start.
That means emphasizing:
- Aggregated views over individual device detail
- Exceptions and drift instead of “everything is fine”
- Site-level rollups for fast comparison
Establish Governance Before Growth
Governance must be visible early, not added after incidents. Define who can deploy, change, or access workloads across environments and make that enforcement clear on the dashboard. That is, add role-based access boundaries, environment-level permissions, and policy-compliance signals.
Industrial teams running mixed internal and partner-operated sites rely on governance visibility to prevent configuration drift and unauthorized changes. Platforms like Portainer are often used here to centralize control without slowing operations.
Define Operational Health Around Risk, Not Metrics
Operational health is not about showing more data. It’s about showing what threatens uptime, safety, or compliance. Your management dashboard should show failures, changes, and violations that require action, not streams of raw telemetry.
For instance, if you run edge environments supporting production systems, you can reduce downtime faster when your dashboard emphasizes “what changed since yesterday” or “what is no longer compliant.” This framing helps you focus on risk rather than spending full-time monitoring dashboards to spot anomalies.
{{article-cta}}
Build Lifecycle Awareness Into Daily Operations
Industrial environments change constantly. New devices are added, applications are updated, and older systems fall out of use. Your dashboard must make these transitions visible, or risk accumulates quietly.
Lifecycle awareness means clearly showing when workloads were deployed, which versions run where, and which devices or environments are no longer active.
This visibility helps you plan updates without disrupting production. It also prevents unsupported software from lingering unnoticed. When lifecycle signals are part of daily operations, you can control change rather than react to it.
IoT Device Management Dashboard Examples
Here are three conceptual examples of an IoT device management dashboard:
Portainer for Edge Infrastructure Management
Portainer manages the containerized software layer running on edge hardware, not the sensors or telemetry beneath it. For instance, in a multi-site manufacturing environment, that distinction matters because software inconsistencies across edge nodes are one of the most common causes of unreliable data pipelines.
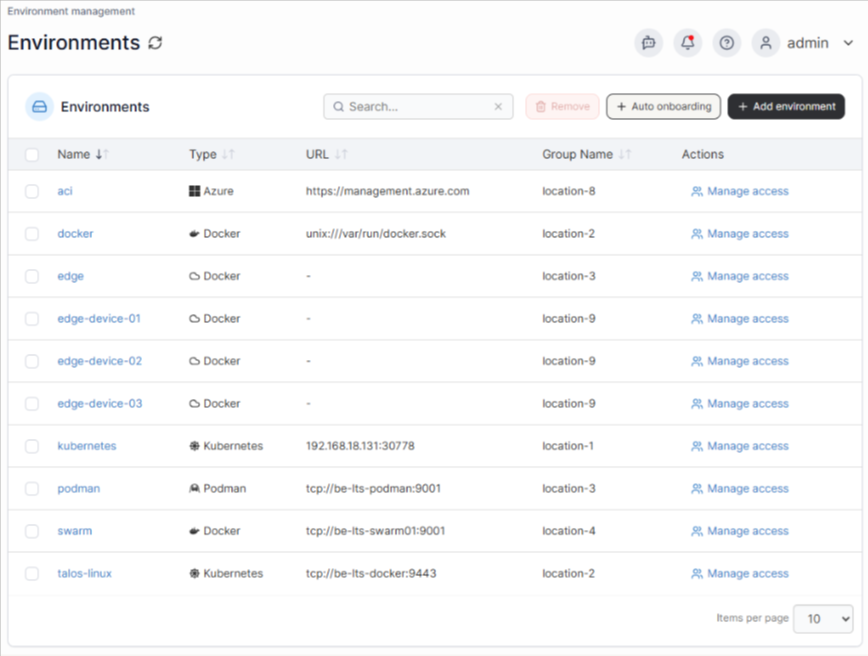
A Portainer dashboard shows the:
- Container health per node: Displays the running, restarting, or stopped status across every edge device, so a container that has been silently restarting on a remote node since 3 am shows up immediately instead of surfacing hours later as a data gap.
- Image version consistency: Compares software versions running across all sites, identifying nodes on outdated builds. Version mismatches between sites are a common root cause of data inconsistencies that are otherwise difficult to trace.
- Resource utilization: Monitors memory and CPU usage per node, alerting when devices approach capacity before they fail. A node running at 94% memory will degrade silently until the buffering container crashes and the site loses production data.
- Remote stack deployments: Push config updates to all sites from a single screen, eliminating the need for individual SSH sessions per node.
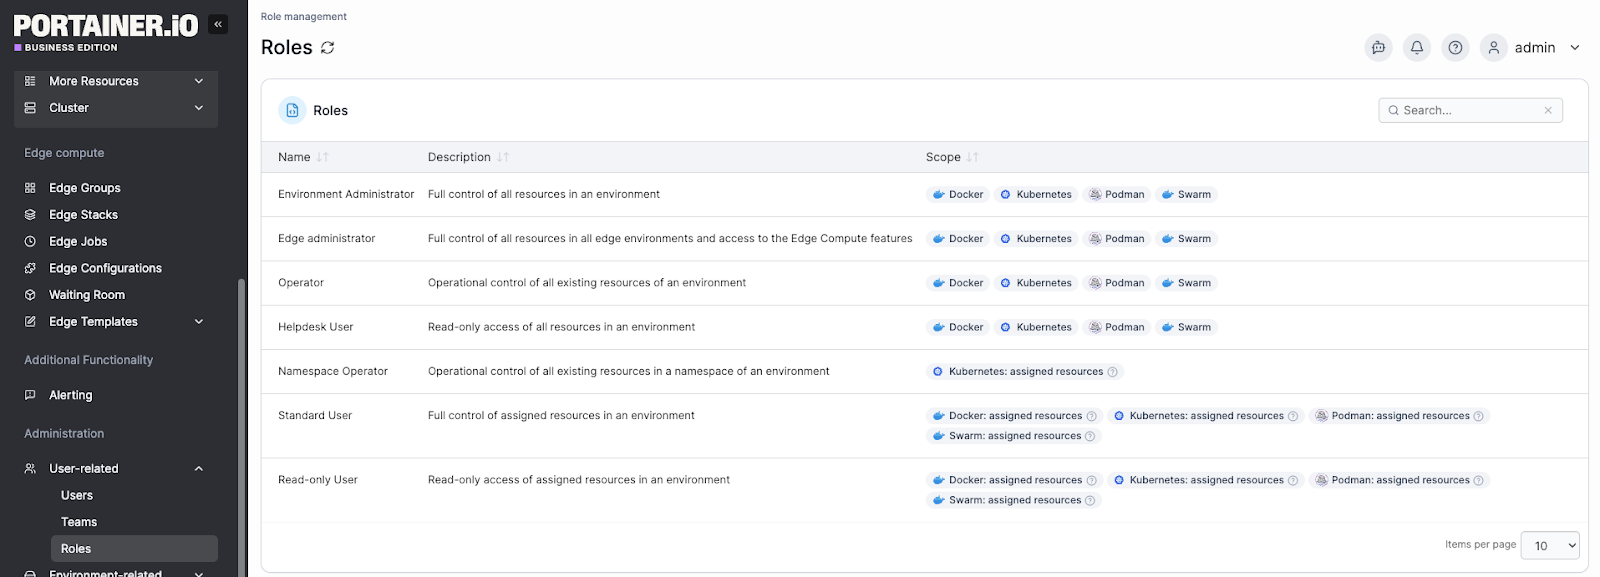
- Security and access control at scale: Assigns role-based permissions per user, per team, and per environment, so a technician at one facility can only access the nodes assigned to them. This control prevents accidental or unauthorized changes to edge deployments across other sites.
In short, if you manage distributed edge infrastructure, Portainer cuts cross-site software diagnosis from hours to minutes.
Book a demo for a first-hand experience on how Portainer gives you full control over industrial edge software at scale, without adding management overhead.
AWS IoT Core Dashboard for Utility Grid Monitoring
A regional utility managing thousands of pressure and flow sensors across a distribution network faces a specific risk: a sensor going offline near a critical node may go unnoticed until the downstream consequence is already underway.
The dashboard below is an AWS IoT SiteWise Monitor portal that visualizes operational data from connected industrial assets in real time.
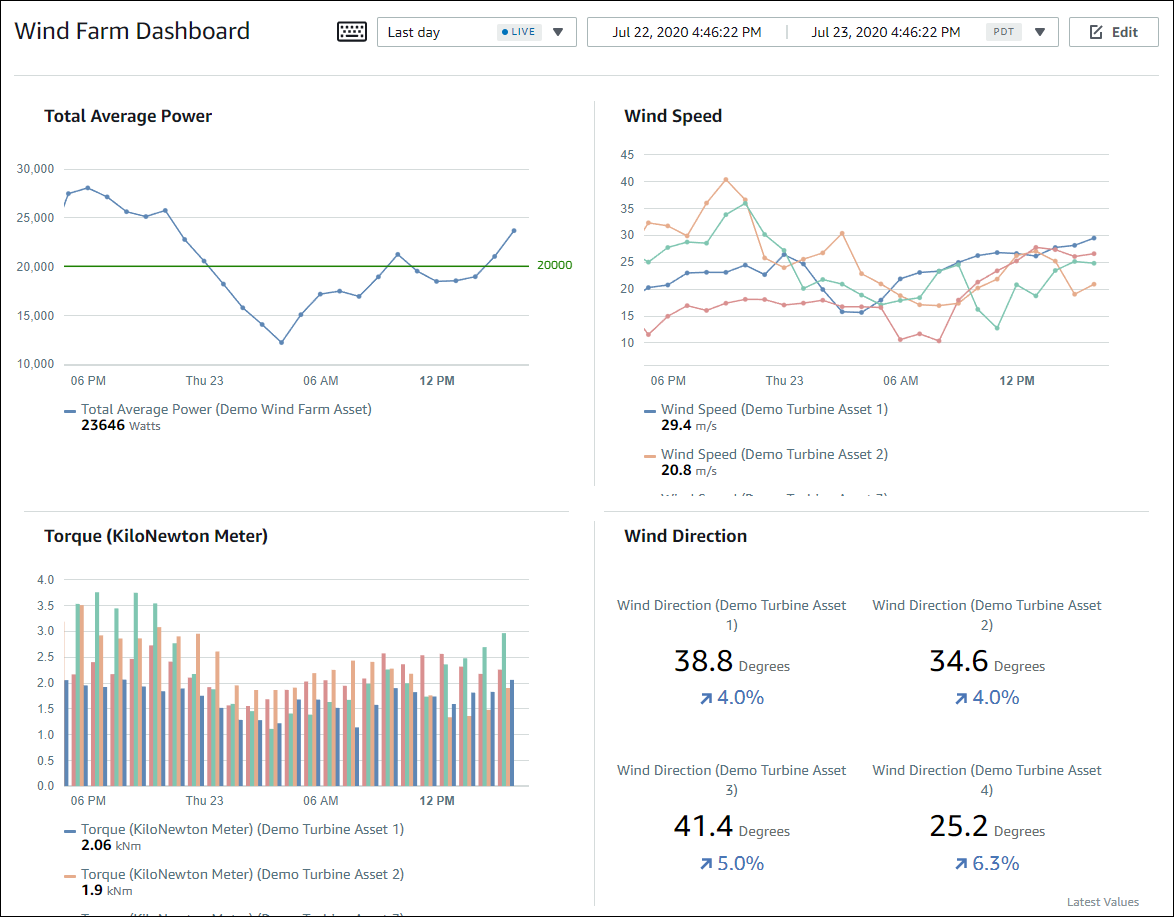
Looking at the dashboard, here is what the on-call engineer works with:
- Live asset property readings: Displays current values from connected sensors alongside historical trends in the same view, so operators compare real-time readings against expected patterns without switching screens.
- Time-series graphs per asset: Plots sensor data over a configurable time window, making gradual deviations visible. A pressure reading drifting downward over 40 minutes is easy to miss in a raw data feed, but immediately visible on a trend line.
- Threshold-based alarms: Fires alerts when a property exceeds its defined operating range for a set duration, removing the need for operators to manually watch readings across thousands of devices simultaneously.
- Per-project asset access control: Restricts each engineer or team to the assets assigned to their project, so a field technician in Zone 3 only sees Zone 3 devices, reducing noise and preventing accidental configuration changes elsewhere.
Losant Dashboard for Distributed Retail Cold-Chain Monitoring
For a retail network operating refrigeration units and HVAC systems across hundreds of locations, the operational problem is not data volume. It is exception detection at scale. A refrigeration unit drifting out of range overnight at one of 400 stores will not get flagged unless the monitoring system surfaces it automatically.
The dashboard below is a Losant cold chain monitoring deployment that shows how temperature-sensitive assets are tracked across location, time, and status in a single view.
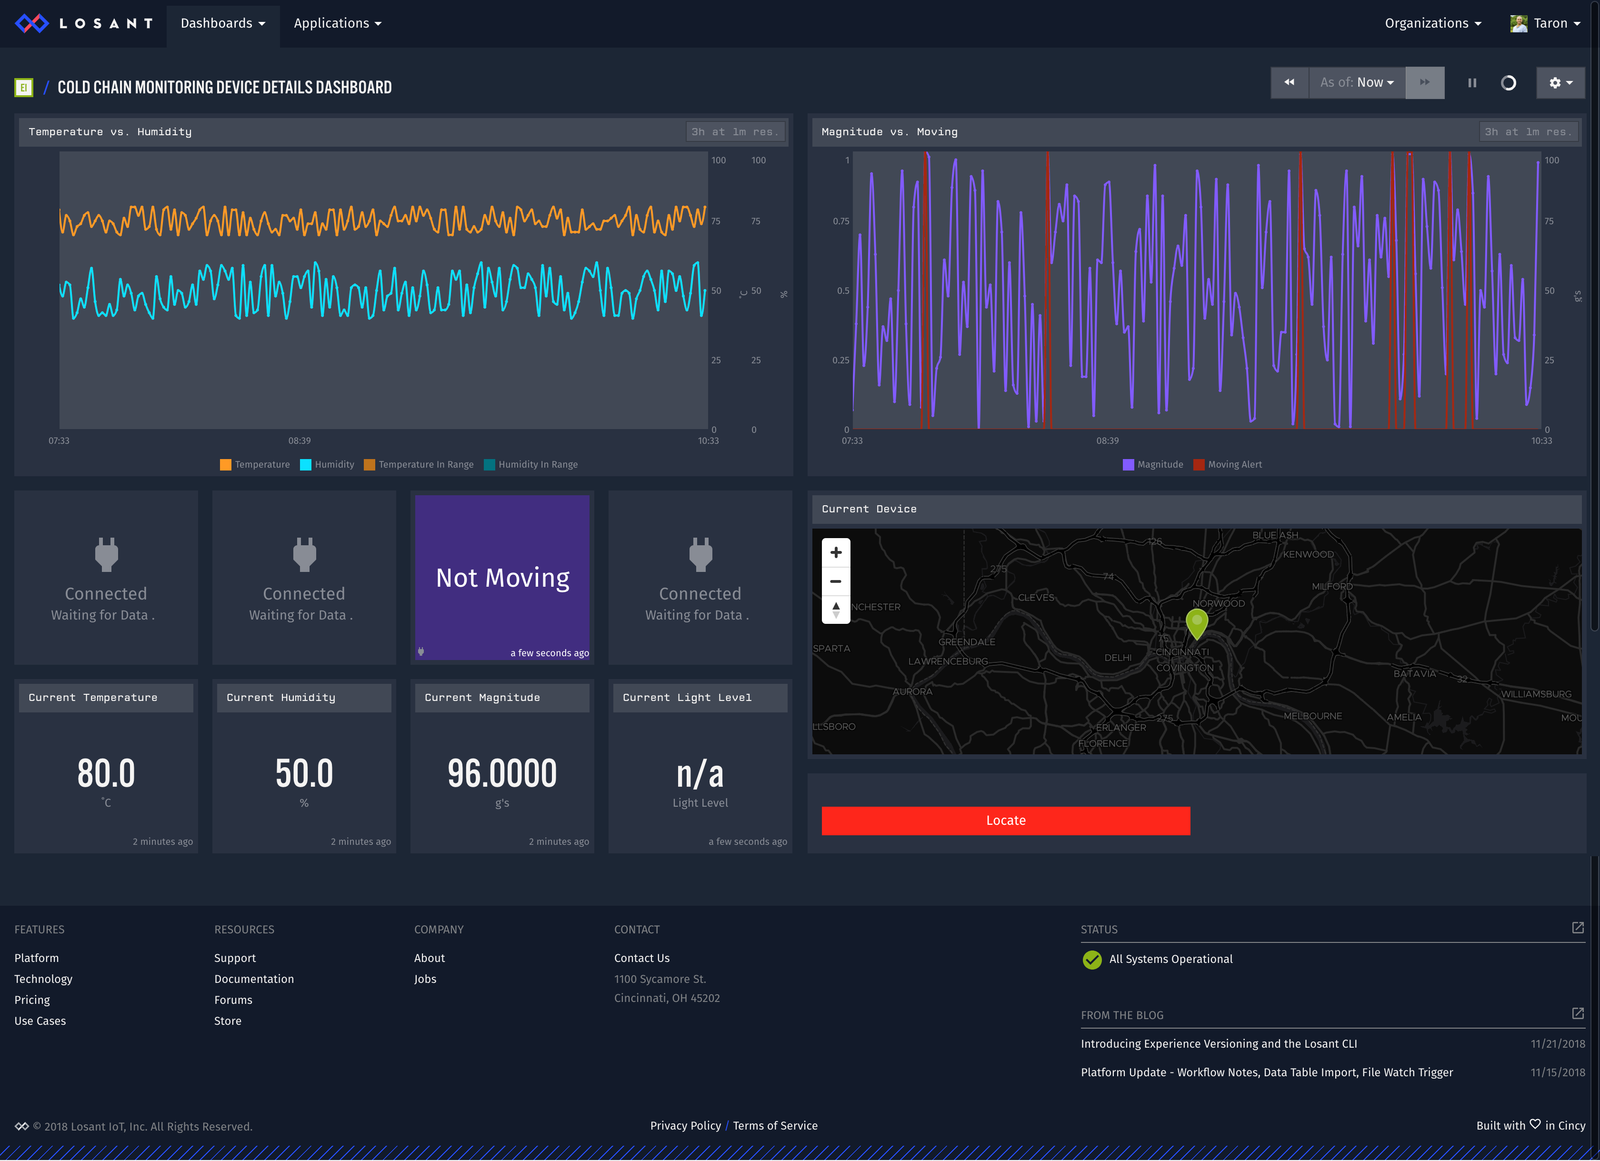
Looking at the dashboard, here is what the facilities team works with:
- GPS location history map: Tracks the location of each monitored asset and maps it geographically. For distributed retail, this view translates to a store-level map showing which locations have active devices and which have gone silent.
- Temperature and humidity time-series graphs: Plots sensor readings over time per unit, so a gradual upward drift over six days is visible at a glance. A slow drift points to a refrigerant issue. A sudden spike points to a door seal problem. Both are actionable before product loss occurs.
- Motion and status indicators: Displays a live status block showing whether an asset is active or inactive, using color-coded indicators. In a retail context, this translates to flagging units that have stopped reporting or dropped outside their normal operating state.
- Multi-sensor layout for deployment: Combines location, environmental, and status data into a single screen, so the facilities team does not need to cross-reference three separate tools to understand what is happening at a single store.
A three-person facilities team can manage exception monitoring across a 400-store refrigeration estate using this approach, rather than depending on store-level staff to detect and report problems.
Gain Centralized Visibility and Control of Your IoT Edge with Portainer
Managing containerized workloads across distributed edge sites creates three compounding problems: deployment overhead, access control gaps, and configuration drift that builds quietly until something breaks.
Portainer solves all three from a single interface. The Aveiro Tech City Living Lab (ATCLL) used it to eliminate manual deployments, automate governance across partner-operated sites, and maintain centralized control over a growing urban edge infrastructure without adding headcount.
Contact our technical sales team to see how enterprises run industrial IoT operations with confidence, predictability, and sustainability.

.png)
.png)