Share this post
Kubernetes can be unpredictable. Pods restart, nodes fluctuate, and limited visibility can make every incident feel bigger than it is. Monitoring shows what’s happening inside your cluster, helping you act before performance or cost takes a hit.
In this article, we will break down what Kubernetes monitoring is, why it matters, the key metrics to track, and how to build an effective monitoring pipeline. You’ll also see how Portainer strengthens day-to-day visibility and control as your clusters grow.
What Is Kubernetes Monitoring?
Kubernetes monitoring tracks metrics, logs, and traces across clusters, nodes, pods, and applications to give teams real-time visibility into workload behaviour.
Unlike traditional monitoring, it must account for short-lived containers, autoscaling, and constantly shifting resources, which means signals need to be collected and analysed far more frequently. Teams should track:
- System-level workloads that power the control plane
- Cluster state and events exposed through the Kubernetes API
- Application behaviour from pod startup to scaling and service interactions
This depth of data helps teams diagnose pod restarts, scheduling failures, resource pressure, and other forms of operational overhead, while also informing decisions about scaling and resource limits.
If you want to see how operational visibility ties into day-to-day Kubernetes management, here is a quick Portainer walkthrough:
The Ultimate Kubernetes Management Tool
Why Monitoring Kubernetes Matters
Let’s look at the key reasons Kubernetes monitoring is essential:
1. Improves application reliability
According to an industry survey, 31% of cloud-native teams struggle to identify errors more slowly due to observability gaps. That’s a serious issue in Kubernetes, where the platform is always interacting with workloads through networking, scheduling, and automated controllers.
Failures in kube-proxy or node agents often masquerade as app issues, making early detection through monitoring essential.
2. Speeds up troubleshooting
Traditional infrastructure tools rarely capture Kubernetes-specific signals, like pod evictions, failed scheduling attempts, or control-plane errors.
Kubernetes-aware monitoring surfaces these patterns clearly, helping engineers trace issues faster and keep services stable under peak or unpredictable demand.
For a deeper look at diagnosing these infrastructure failures, you can read our comprehensive guide on Kubernetes troubleshooting.
3. Reduces unnecessary cloud spend
Unmonitored clusters often waste capacity through oversized deployments or runaway containers. Studies show some Kubernetes workload types waste 60-80% of allocated CPU and memory due to overprovisioning.
Monitoring reveals how workloads request and consume resources, enabling teams to right-size environments and avoid costly overprovisioning.
4. Strengthens governance and compliance
Kubernetes relies on controllers, admission rules, and automated policies to maintain the desired state. These mechanics define Kubernetes governance, and when they drift, clusters can become misaligned without notice.
Monitoring surfaces policy violations, abnormal control-plane behaviour, and unauthorised changes to reduce operational and compliance risk.
5. Enables better capacity planning
Kubernetes workloads shift frequently as pods scale, restart, and redistribute across nodes. Monitoring reveals long-term patterns in resource usage and traffic, helping teams plan capacity accurately and avoid both overprovisioning and sudden performance bottlenecks.
How Kubernetes Monitoring Works
Kubernetes generates operational data from workloads and system components. Monitoring tools capture and interpret this data to show how the cluster behaves at any given moment. At a high level, here is what enables that visibility:
1. Signal collection across the cluster
Kubernetes produces a constant stream of metrics, logs, and traces from nodes, pods, system workloads, and the control plane. Exporters, node agents, and the Kubernetes API expose these signals so monitoring tools can retrieve them.
This establishes the raw visibility needed to understand how workloads respond to scheduling, resource pressure, and network activity.
2. Data aggregation and processing
Once signals are collected, monitoring systems store them in a central repository for analysis. Prometheus is commonly used for this stage and can scrape thousands of targets across clusters while managing retention, performance, and query execution.
Teams can also deploy the Prometheus monitoring stack through Portainer for a guided setup within their Kubernetes environment.
3. Correlation across Kubernetes layers
Infrastructure data on its own does not explain workload behaviour. Kubernetes monitoring correlates node performance, control-plane activity, pod health, and service performance to show how issues move across components.
This reveals patterns, such as rising latency caused by node pressure or deployment failures, and misconfigured requests.
4. Visualisation and dashboards
Dashboards transform collected signals into charts and timelines, making cluster behaviour easier to interpret. Tools like Grafana help teams view trends in resource usage, request performance, and error rates.

Portainer adds operational visibility by showing real-time container status, resource consumption, and cluster activity, which helps teams spot irregular patterns early.
5. Alerts and automated responses
Monitoring systems compare incoming data against alert rules to detect failures or performance issues.

Teams can configure alerts for conditions like offline detection, high CPU and memory load, or high network usage, ensuring they receive notifications before issues affect users. Alerts support proactive response and reduce the time needed to resolve cluster-wide problems.
What to Monitor in Kubernetes (Key Metrics & Signals)
Now that we know how Kubernetes monitoring works, let’s look at the core metrics and signals teams should track to understand cluster health and workload behaviour.
1. Cluster health and control-plane signals
These signals indicate how well Kubernetes schedules, places, and manages workloads.
Key metrics to track:
- API server latency: slows scheduling, deployments, and scaling.
- Scheduler queue depth: highlights resource shortages before pods go Pending.
- Controller reconciliation performance: reveals drift between desired and actual state.
- etcd health and latency: signals delayed updates and cluster instability.

2. Node resource utilisation
Nodes supply the CPU, memory, storage, and network capacity that workloads depend on.
Key metrics to track:
- CPU utilisation and throttling: slows or evicts workloads under pressure.
- Memory usage and pressure events: triggers OOM kills and unstable behaviour.
- Disk space and inode availability: affects logging, image pulls, and core system daemons.
- Network throughput and error rates: expose NIC failures, CNI issues, or bottlenecks.

Clear visibility into resource consumption helps prevent node-level issues from cascading into pods.
3. Pod performance and lifecycle events
Pod lifecycle signals show how applications behave inside Kubernetes.
Key metrics to track:
- Restarts and crash loops: indicate bugs or misconfigurations.
- Readiness/liveness probe failures: show containers unable to serve traffic.
- Image pull errors: point to network or registry authentication issues.
- Pending/unschedulable pods: expose taints, resource misalignment, or RBAC-related restrictions.

4. Application-level performance metrics
These signals show user-experienced behaviour beyond what infrastructure data reveals.
Key metrics to track:
- Request latency: measures responsiveness and highlights overload or dependency slowness.
- Error rates: signal failing upstream services or overloaded pods.
- Throughput and saturation: indicate when applications are nearing capacity.
- Dependency behaviour: surface bottlenecks across multi-service systems.
5. Network and traffic behaviour
Networking is one of the most failure-prone layers in Kubernetes.
Key metrics to track:
- Packet drops/retransmissions: indicate congestion, MTU mismatches, or CNI issues.
- DNS lookup times: slow resolution that cascades into microservice failures.
- Service mesh/ingress patterns: reveal routing issues or retry storms.
- Unauthorised or unexpected traffic: catches configuration drift or container security concerns.
Setting Up Kubernetes Monitoring (Step-by-Step)
Monitoring works best when it is deployed methodically across the cluster. Here are the key steps to set up a reliable Kubernetes monitoring pipeline.
Step 1: Choose your metrics collection method
Before deploying tools, decide how metrics will be collected. Kubernetes supports several approaches:
- Kubernetes Metrics Server: Covers basic autoscaling metrics but excludes application and control-plane signals.
- Sidecar containers: Capture pod-level behaviour, but add overhead to every workload.
- DaemonSet-based agents: Gather node and system metrics consistently across the cluster but cannot observe pod internals.
- eBPF-based monitoring: Offers cluster and pod visibility with minimal overhead and no workload changes.
Selecting the right method determines how deep and efficient your monitoring pipeline will be.
Step 2: Install exporters and system-level collectors
After choosing a collection method, deploy the components that expose metrics across the cluster. Common tools include:
- Node-exporter for node-level performance
- Kube-state-metrics for Kubernetes object state and scheduling signals
- cAdvisor for container and pod resource usage
- Control-plane exporters for scheduler, API server, and controller-manager behaviour
These collectors supply the data your monitoring backend will analyse.
Step 3: Deploy a metrics storage and scraping backend
A backend collects and stores metrics for analysis. While Prometheus is the standard for auto-discovering workloads, integrating it with a dedicated container monitoring platform ensures that data remains accessible and actionable across multi-cluster or hybrid environments.
Portainer lets you deploy and manage these stacks across any environment, including lightweight setups like MicroK8s.
Step 4: Configure scrape targets, collection frequency, and retention
Once the backend is live, define which signals it should ingest and how long they’re stored. This includes:
- Selecting scrape targets across clusters and namespaces
- Tuning scrape intervals to match workload volatility
- Setting retention windows that balance cost with operational insight
A good configuration ensures monitoring stays accurate, responsive, and aligned with how your workloads behave in real traffic.
Step 5: Build dashboards for cluster, node, and application insight
Dashboards allow teams to spot patterns and diagnose issues across clusters. Tools like Grafana and Prometheus surface trends in utilisation, latency, and errors, while Portainer adds real-time operational visibility into containers, resources, and cluster activity.
Together, they make it easier to understand what’s happening across your environment.
Step 6: Set up alert rules and notification channels
Alerts turn monitoring into action. Configure rules for repeated pod restarts, OOM kills, high API server latency, node pressure, and rising application errors. And send notifications through Alertmanager, Datadog, or your preferred incident platform to Slack, email, or on-call systems.
{{article-cta}}
Use Portainer for Kubernetes Monitoring
Monitoring becomes far more effective when teams pair observability with an operational management layer. Observability shows what is happening, while operational visibility explains why. Portainer brings that operational clarity.
Let’s take a look at how Portainer fits into a modern Kubernetes monitoring setup.
Portainer
Portainer is a self-hosted control plane that helps teams operate Kubernetes, with support for Docker and Podman where required. It provides core operational visibility into workloads, resources, and governance, while purpose-built tools like Prometheus, Grafana, and Datadog continue handling advanced metrics, logs, and traces.
Key Features
Here are some of the features that make Portainer a strong operational partner to your Kubernetes observability stack:
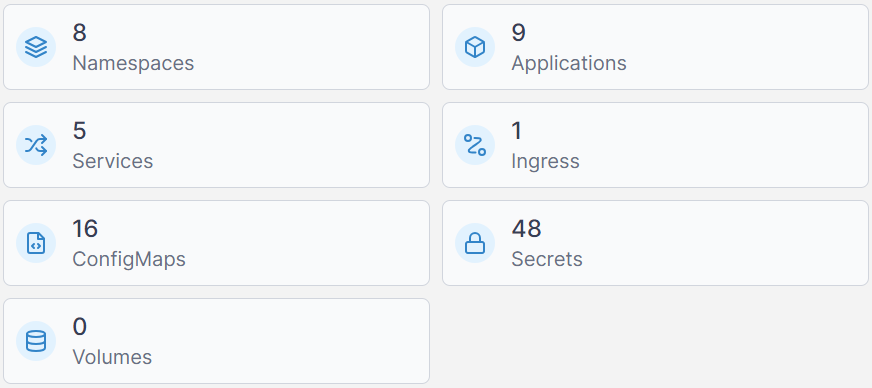
- Real-time workload and resource visibility: Monitor pods, containers, nodes, and deployments through a unified UI that shows what’s running, how it’s behaving, and where resources are being consumed.
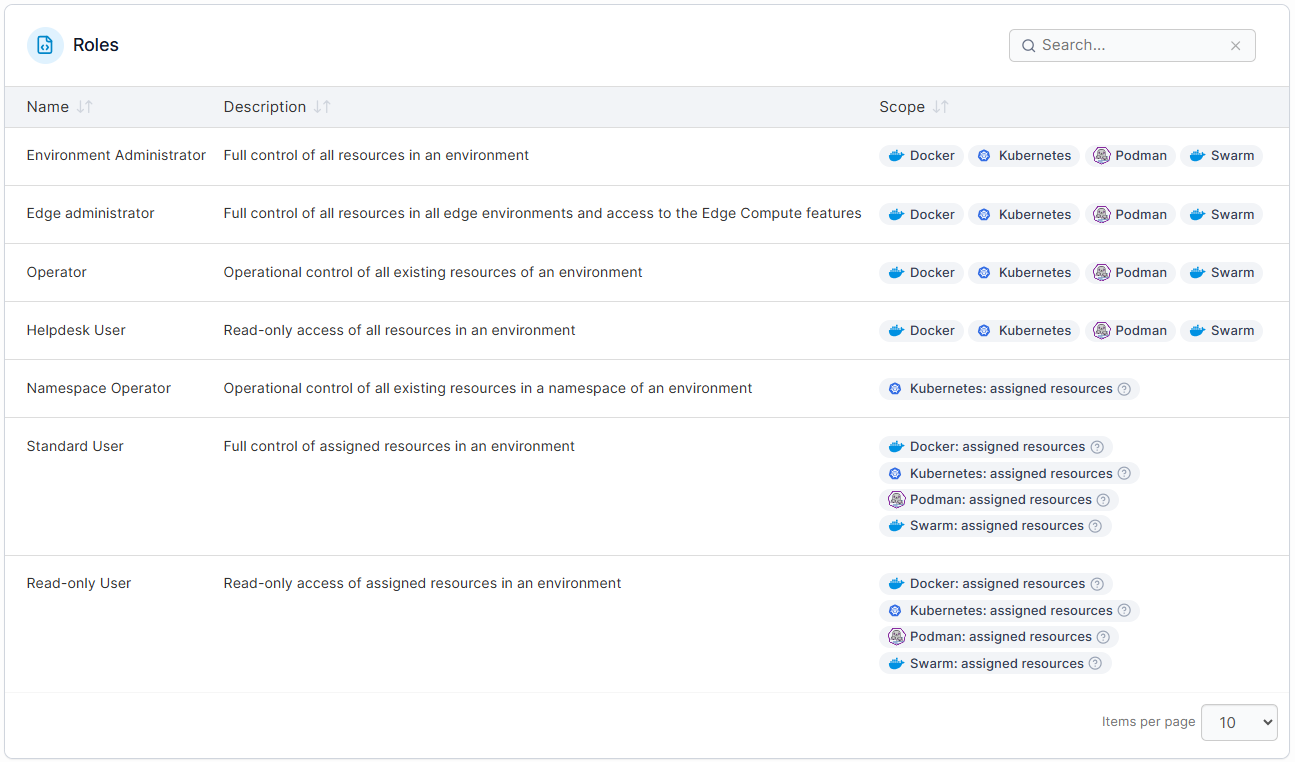
- Cluster and governance insights: Surface configuration drift, policy violations, and access behaviour using built-in RBAC, audit logs, and environment-level governance controls.
- Easy deployment of monitoring tooling: Deploy components like Prometheus, node-exporter, or kube-state-metrics through Helm charts or stack templates to standardise monitoring setups across clusters with less operational effort.

- Operational tooling for troubleshooting: Inspect logs, review events, restart workloads, manage volumes, adjust resources, or scale deployments directly from the UI to shorten the incident-analysis feedback loop.
- Multi-cluster and hybrid environment control: Manage Kubernetes clusters from one interface, maintain consistent policies, and review cluster health without juggling dashboards or CLI workflows.

- Built-in alerting to support monitoring workflows: Portainer’s optional observability layer lets teams configure alert rules (environment down, high CPU/memory, backup failures, TLS expiry), edit thresholds, silence alerts during active incidents, and route notifications to Slack, Teams, email, or webhooks through the bundled Alertmanager.
New Feature – Portainer 2.32 STS Observability
Pricing
Portainer provides enterprise-grade management, RBAC, and multi-cluster governance at a fraction of the cost of full-stack Kubernetes platforms.
For complete plan details and volume-based options, visit Portainer’s Enterprise PKubernetes monitoringricing page.
What Portainer’s customers say
“Portainer makes container management incredibly straightforward. The UI is clean and intuitive, which saves a lot of time compared to manually managing Docker or Kubernetes through CLI. It’s easy to deploy and we use it frequently for day-to-day container tasks. Setting up environments, managing stacks, and monitoring resource usage feels effortless. The role-based access control and team management features are also very handy in a collaborative setup,” says Bharath D.
“Portainer has been the central operation base for making orders and delivery of services to our clients. It secures data that is integrated in its systems ensuring there is no unauthorised access. It has intuitive general user interface that offers easy access to information,” shares Susan D.
Common Challenges in Kubernetes Monitoring
Even with strong tooling, Kubernetes monitoring comes with operational hurdles. Here are some of the challenges engineers face most often:
1. Signals spread across too many layers
Kubernetes emits metrics from nodes, pods, containers, the control plane, and the network stack. Each layer uses different exporters, APIs, or scraping points, which makes it easy to miss critical signals when you inherit a whole new Kubernetes toolchain. In many cases, collecting the right data becomes harder than interpreting it.
2. Correlation is difficult and fragmented
Kubernetes spreads related signals across nodes, pods, controllers, and the control plane. These pieces rarely align cleanly, leaving engineers to jump between dashboards and logs to understand each issue. This fragmentation slows investigations and makes even simple incidents feel bigger than they are.
3. Short-lived workloads remove context
Pods restart, reschedule, or disappear before operators can review what happened. Crash loops, OOM kills, and failed rollouts may leave little trace in the live cluster, which makes root-cause analysis harder and incident reviews more dependent on whatever data was captured in the moment.
4. Governance challenges restrict visibility
RBAC is essential, but it often becomes an obstacle during incidents. Teams may lack access to specific namespaces, logs, or node metrics, which introduces delays and escalations in critical moments. Poorly structured permissions create RBAC-related blind spots.
5. Monitoring overhead grows as clusters scale
As teams add more namespaces, workloads, clusters, and exporters, Kubernetes complexity becomes a system of its own to maintain. Storage backends must scale, Kubernetes dashboards must stay aligned, and alert rules must evolve with new services.
Eventually, the monitoring stack becomes as operationally demanding as the platform it observes.
This is often the point where teams start evaluating a Kubernetes dashboard alternative that reduces operational overhead while improving cross-cluster visibility.
Best Practices for Efficient Kubernetes Monitoring
Monitoring Kubernetes isn’t just about collecting data; it’s about making that data useful as clusters grow and change. Here are practices that support clearer, more reliable insight.
1. Correlate signals across layers
Kubernetes issues rarely stay isolated. A node CPU spike, pod probe failure, and slow scheduler event can all stem from the exact root cause. Connecting signals across nodes, pods, the control plane, and application surfaces patterns faster, and makes the real issue easier to identify.
2. Use contextual alerting
Fixed CPU or memory thresholds break quickly in Kubernetes because workloads scale, restart, and reschedule constantly. Alerts should reflect behaviour over time, such as how long a condition persists, whether autoscaling is running, or whether the pattern is normal. Strong governance models make these alerts more accurate and reduce noise.
3. Analyse data in real time
Pods restart in seconds, and nodes shift under autoscaling. If analysis lags, the signal that caused the disruption disappears. Real-time ingestion and visualisation capture transient spikes, short-lived crash loops, scheduling failures, and ephemeral container states before the evidence is lost.
4. Preserve short-lived workload signals
Ephemeral pods often vanish before teams can inspect what happened. To avoid losing critical context, teams should:
- Increase scrape frequency
- Forward logs to persistent storage
- Retain events long enough for RCA
- Apply unique labels so workloads can be reconstructed later
This makes post-incident analysis possible even after the pod is gone.
5. Keep monitoring overhead predictable
As clusters grow, monitoring can become heavier than the workloads it observes. Limiting high-cardinality metrics, tuning retention windows, and avoiding overly heavy instrumentation keep monitoring efficient and aligned with production performance, especially when running lightweight OSes like Talos.
Simplify Kubernetes Management and Monitoring with Portainer
Strong observability tells you what is happening, but teams also need an operational layer that makes running Kubernetes every day.
Portainer brings that clarity by giving you a unified way to manage clusters, keep configurations aligned, and apply governance consistently across environments.
If you want to secure your Kubernetes environments and operate them with greater predictability, book a demo today and see how Portainer fits into your workflow.